Businesses collect information from websites, sales platforms, customer databases, marketing campaigns, and many other sources. Raw data is not always easy to read. Rows of numbers and large spreadsheets make it harder to see a pattern, compare performance, and explain what the numbers mean.
That is where data visualization tools help. They turn complex information into charts, graphs, dashboards, and interactive reports so people can see what is happening and decide with better information.
Understanding the different data visualization methods can also help you choose the right visual format for your information, whether you are comparing performance, identifying trends, or presenting business results.
The range runs from simple spreadsheet charts to advanced business intelligence platforms. Some tools are built for beginners. Others add advanced analytics, data modeling, and customization.
This guide covers the main data visualization tools, their features, advantages, limitations, and practical use cases. It also shows how to compare platforms and choose the software that fits the work.
What Are Data Visualization Tools?
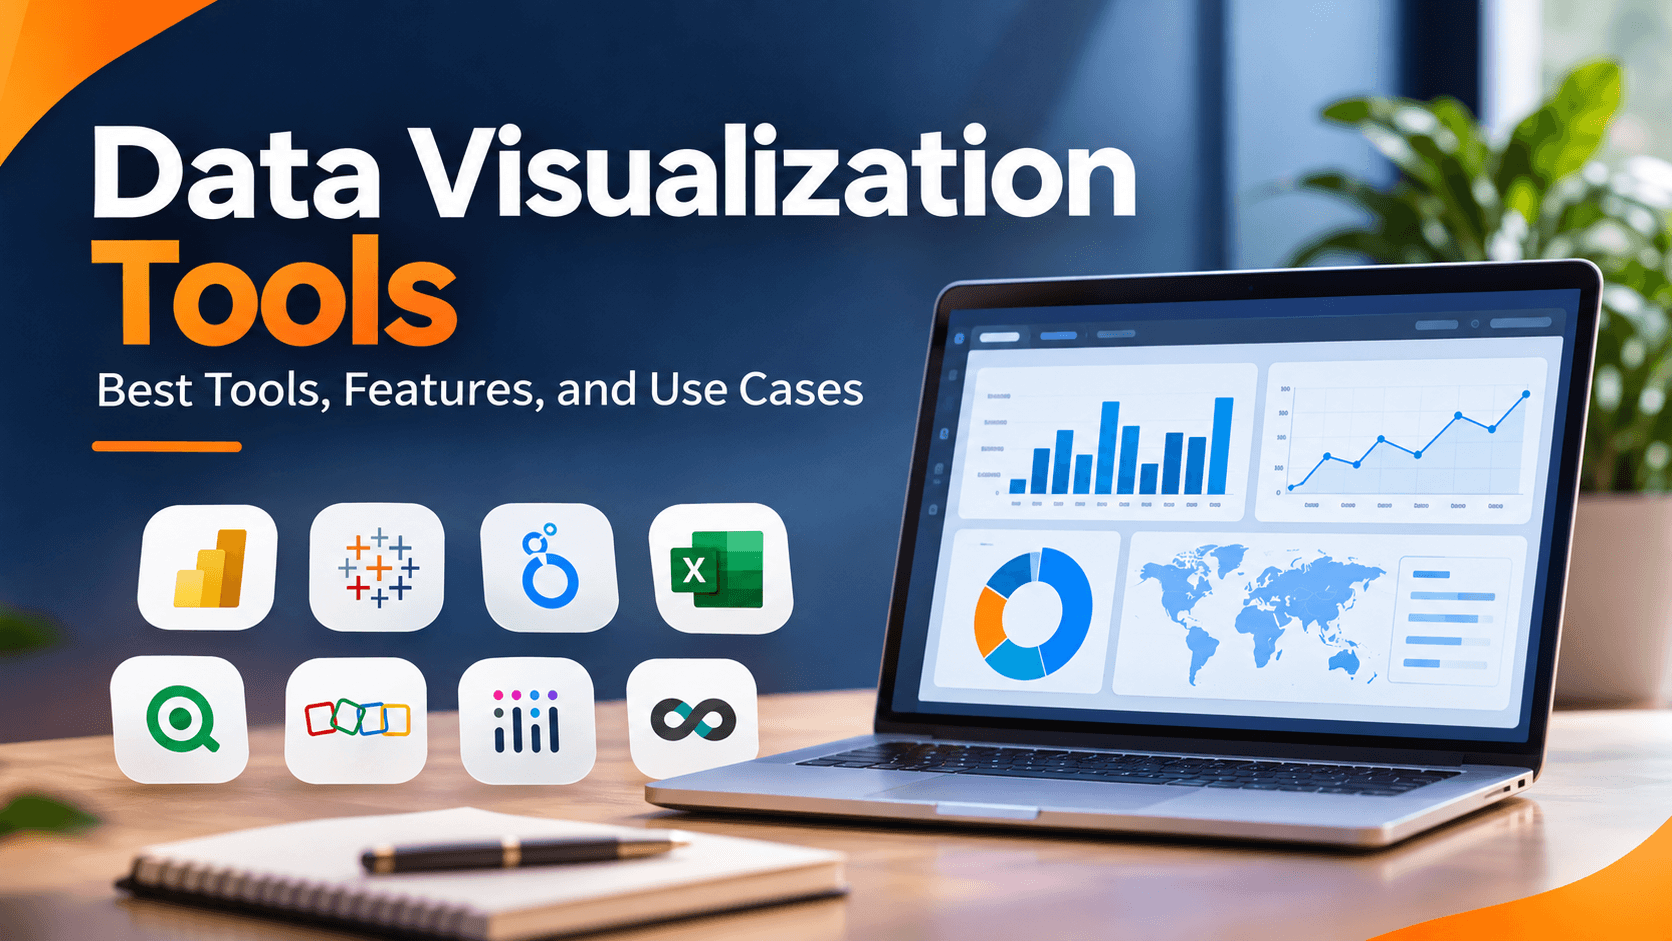
Data visualization tools are software that turns raw data into charts, graphs, maps, dashboards, and interactive reports. They help people see trends, relationships, patterns, and unusual changes in a dataset.
Instead of reading thousands of spreadsheet rows, you can build a visual report of monthly sales, customer behavior, website traffic, or business performance.
A marketing team can use a dashboard to compare website traffic across campaigns. A finance team can show revenue and expenses over time. A sales team can watch monthly targets and performance.
Most platforms let you connect data sources, pick a visual format, customize the report, and share it. More advanced tools can also transform data, filter interactively, support collaboration, and add business intelligence features.
Why Are Data Visualization Tools Important?
Data visualization does more than make information look attractive. It helps people read the data, explain findings, and spot opportunities that are hard to see in a raw dataset.
1. Make Complex Data Easier to Understand
A large dataset is hard to read as a spreadsheet. Charts, graphs, and dashboards organize the information so trends and relationships are easier to see.
2. Identify Trends and Patterns
Visual reports show change over time, compare categories, and flag unusual results. A line chart, for example, can show whether monthly revenue is rising or falling.
3. Support Better Business Decisions
Managers can use dashboards to watch performance indicators and decide from measurable information rather than assumptions.
4. Improve Communication
Charts and dashboards make findings easier to present to people who do not have a technical or statistical background.
5. Monitor Performance in One Place
A business intelligence platform can pull several sources into one dashboard. Teams can watch sales, marketing, finance, and operations without opening separate reports.
15 Best Data Visualization Tools to Consider
The best tool depends on your data sources, technical skills, reporting needs, budget, and the kind of insight you need to share.
Some tools focus on business intelligence and dashboards. Others are built for spreadsheet reporting, interactive storytelling, or custom visuals written in code. The platforms below cover different needs and experience levels.
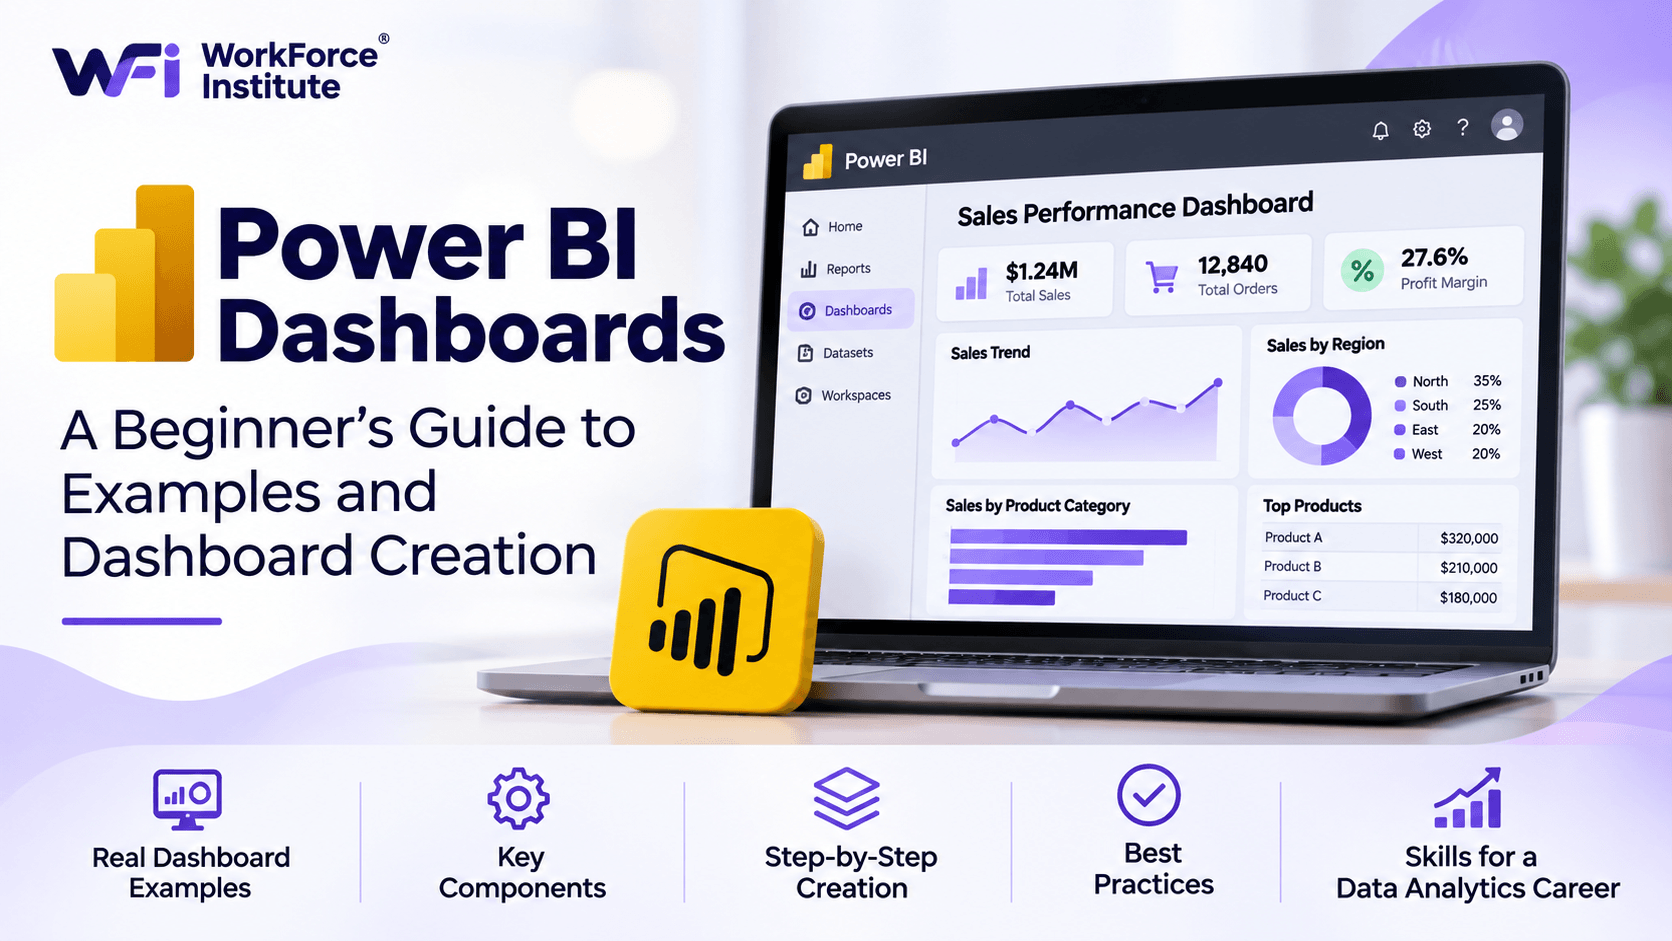
1. Microsoft Power BI
Best for: Business intelligence, interactive dashboards, and organizations using Microsoft products.
Microsoft Power BI is a business intelligence platform. It helps people connect, transform, analyze, and visualize data. Analysts can build interactive reports and dashboards from spreadsheets, databases, cloud services, and other sources.
Power BI is a strong fit for organizations that already use Microsoft Excel, Azure, Teams, and other Microsoft services.
Key Features:
- Interactive dashboards and reports.
- Connections to multiple data sources.
- Data modeling and transformation capabilities.
- Custom calculations using Data Analysis Expressions (DAX).
- Report sharing and collaboration through supported Power BI services.
- Integration with other Microsoft products.
Advantages:
- Provides a wide range of visualization options.
- Supports detailed business reporting and analysis.
- Works well with Microsoft-based workflows.
- Offers a desktop application for report creation.
Limitations:
- Advanced data modeling can require technical knowledge.
- Sharing and collaboration may require additional licensing.
- Complex reports can take time to design and maintain.
Common Use Cases: Sales dashboards, financial reporting, marketing performance analysis, inventory monitoring, and business performance tracking.
2. Tableau
Best for: Advanced visual analytics and interactive business dashboards.
Tableau is a data visualization and business intelligence platform for exploring datasets and building interactive visual reports. Users can connect different data sources and build dashboards in a visual interface.
Analysts and organizations often use Tableau when they need flexible visual exploration and detailed reporting.
Key Features:
- Interactive charts and dashboards.
- Connections to databases, spreadsheets, and cloud data sources.
- Visual data exploration and filtering.
- Dashboard customization and sharing.
- Support for mapping and geographic visualizations.
- Advanced analytical and calculation capabilities.
Advantages:
- Provides extensive visualization options.
- Supports detailed exploration of complex datasets.
- Offers flexible dashboard design.
- Can support a variety of business reporting requirements.
Limitations:
- Some advanced features require training and practice.
- Licensing costs should be evaluated for larger teams.
- Preparing and maintaining complex data sources can require additional work.
Common Use Cases: Executive dashboards, financial analysis, customer behavior reporting, operational monitoring, and interactive business presentations.
3. Google Looker Studio
Best for: Web-based reporting, marketing dashboards, and Google ecosystem users.
Google Looker Studio is a reporting and visualization platform for building dashboards and reports from connected data sources.
It fits digital marketing teams that need to present data from Google Analytics, Google Ads, Google Sheets, and other supported sources.
Key Features:
- Browser-based report creation.
- Connectors for supported data sources.
- Custom charts, tables, and scorecards.
- Interactive filters and date controls.
- Dashboard sharing and collaboration.
- Report templates for common reporting needs.
Advantages:
- Accessible through a web browser.
- Useful for marketing and website performance reporting.
- Supports collaborative report sharing.
- Offers a free version for many reporting needs.
Limitations:
- Advanced data preparation may require external tools.
- Some connectors may involve additional costs.
- Complex reporting can depend on the quality and performance of connected data sources.
Common Use Cases: Website traffic dashboards, SEO reporting, advertising performance, campaign monitoring, and marketing analytics.
4. Microsoft Excel
Best for: Beginners, spreadsheet-based reporting, and everyday data analysis.
Microsoft Excel is a spreadsheet application with built-in tools for organizing, calculating, analyzing, and visualizing data.
You can create charts, PivotCharts, tables, and dashboards without a separate business intelligence platform. Excel is especially useful for small and medium-sized datasets, and for reports built from spreadsheet data.
Key Features:
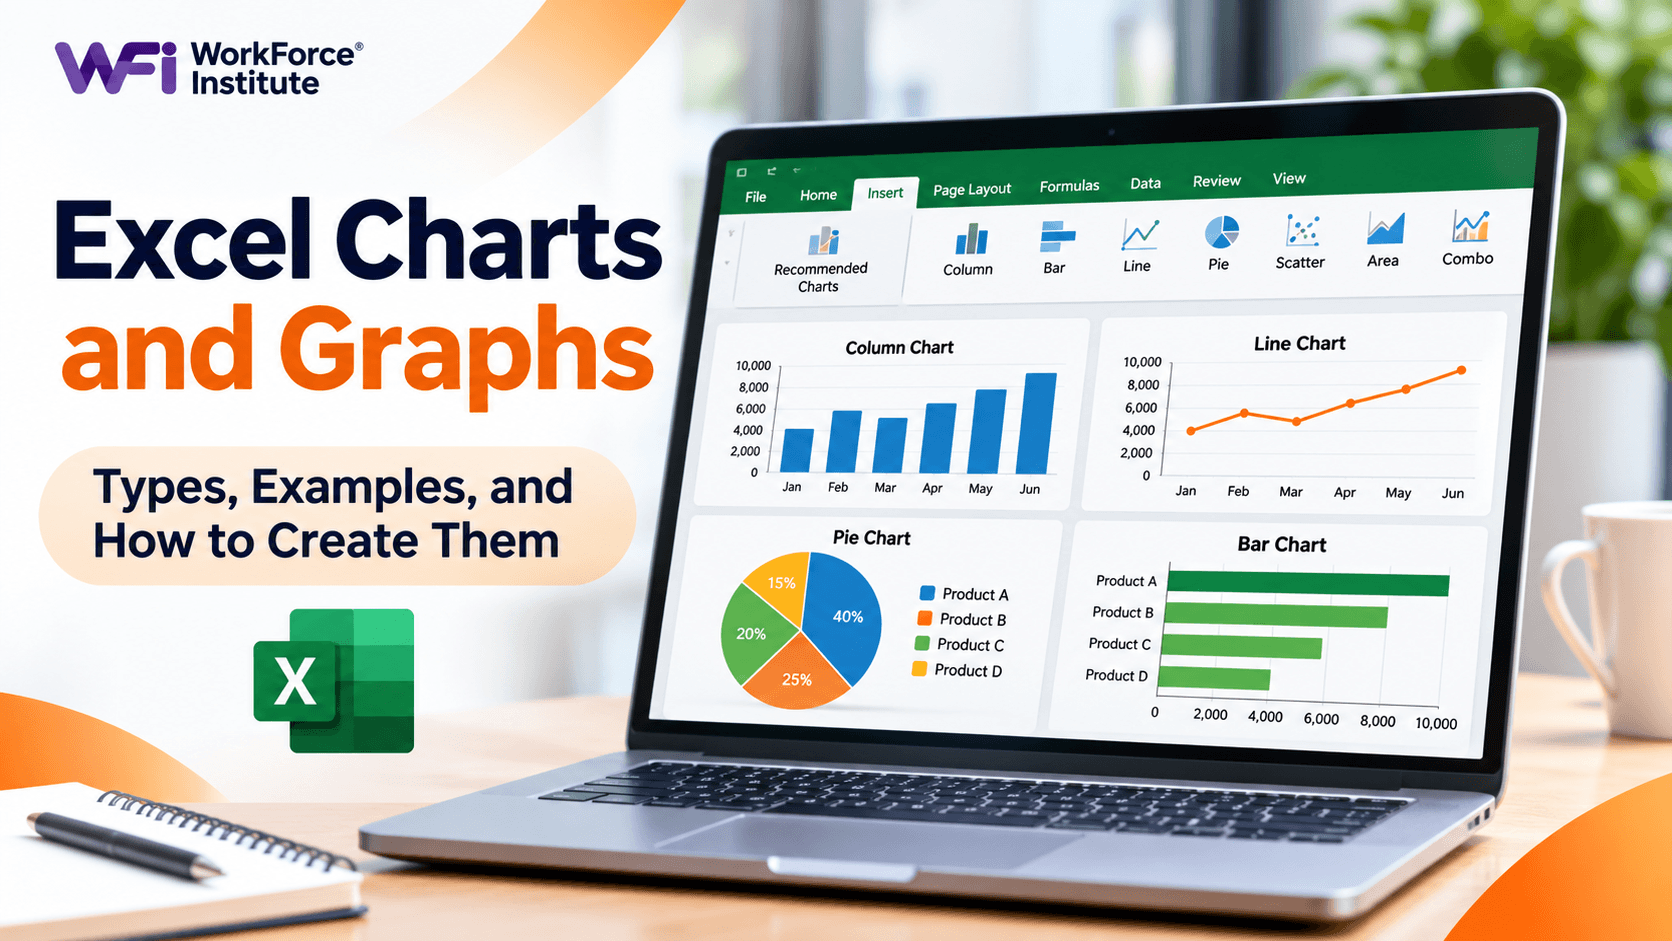
- Column, bar, line, pie, and scatter charts.
- PivotTables and PivotCharts.
- Conditional Formatting.
- Data sorting, filtering, and cleaning.
- Formulas and functions for analysis.
- Power Query for supported data preparation workflows.
Advantages:
- Familiar to many students and professionals.
- Useful for basic and intermediate data visualization.
- Combines data organization, calculations, and chart creation.
- Works well for quick reports and smaller analytical projects.
Limitations:
- Large and complex reporting projects can become difficult to manage.
- Manual updates may create maintenance challenges.
- Advanced dashboards may require additional skills and planning.
Common Use Cases: Sales charts, expense tracking, monthly reports, survey summaries, inventory analysis, and spreadsheet dashboards.
5. Qlik Sense
Best for: Interactive data exploration and business intelligence.
Qlik Sense is an analytics platform for exploring data, building dashboards, and finding relationships across information sources.
Its associative analytics approach lets users interact with the data and follow connections that a traditional report may not show right away.
Key Features:
- Interactive dashboards and visual analytics.
- Associative data exploration.
- Data integration and preparation capabilities.
- Self-service analytics features.
- Collaboration and reporting options.
- AI-supported analytics features in supported products and plans.
Advantages:
- Supports exploration across connected datasets.
- Useful for complex business analysis.
- Provides interactive reporting capabilities.
- Can support enterprise analytics requirements.
Limitations:
- Some features may require training.
- Implementation can be more involved for complex environments.
- Pricing and deployment options should be reviewed according to organizational needs.
Common Use Cases: Financial analysis, supply chain monitoring, sales performance, customer analytics, and operational reporting.
6. Zoho Analytics
Best for: Small and medium-sized businesses that need reporting and business intelligence.
Zoho Analytics is a business intelligence and data analytics platform. It connects information from different sources and turns it into reports and dashboards.
It fits organizations that already use Zoho applications, or that want business systems combined in one reporting environment.
Key Features:
- Interactive dashboards and reports.
- Data connections and integration options.
- Charts, tables, and KPI visualizations.
- Data preparation and analysis features.
- Collaboration and report sharing.
- AI-assisted analytics features in supported plans.
Advantages:
- Provides reporting tools for different business functions.
- Supports multiple data sources.
- Can integrate with other Zoho applications.
- Offers options for organizations with different reporting needs.
Limitations:
- Advanced reporting requirements may need additional setup.
- Some integrations and features depend on the selected plan.
- Users may need time to learn the platform's reporting capabilities.
Common Use Cases: Sales reporting, financial dashboards, marketing analysis, customer reporting, and operational performance monitoring.
7. Domo
Best for: Organizations that need connected business data, dashboards, and reporting workflows.
Domo is a cloud-based business intelligence platform. It brings data from different sources into a shared analytics environment.
It supports data integration, visualization, dashboard creation, and business reporting. Organizations use it to monitor key performance indicators and share information across teams.
Key Features:
- Cloud-based dashboards and reporting.
- Data integration and connectors.
- Interactive visualizations.
- Business performance monitoring.
- Collaboration and data sharing.
- Data transformation and workflow capabilities.
Advantages:
- Combines several business reporting capabilities.
- Supports information from multiple sources.
- Useful for organization-wide dashboards.
- Provides cloud-based access to reports.
Limitations:
- Pricing should be evaluated for the organization's data and user requirements.
- Implementation may require planning and configuration.
- Advanced workflows can involve a learning curve.
Common Use Cases: Executive reporting, sales and marketing dashboards, financial performance monitoring, and enterprise analytics.
8. Apache Superset
Best for: Technical teams looking for an open-source business intelligence and visualization platform.
Apache Superset is an open-source platform for exploring and visualizing data. Users can connect supported databases, explore datasets, and create interactive dashboards.
It fits organizations with technical teams that want more control over the analytics environment.
Key Features:
- Interactive dashboards.
- SQL-based data exploration.
- Charts and visualization options.
- Database connectivity.
- Dashboard filtering and customization.
- Open-source development and deployment options.
Advantages:
- Open-source software.
- Offers flexibility for technical teams.
- Supports SQL-based analysis.
- Can be deployed in environments managed by the organization.
Limitations:
- Deployment and maintenance require technical expertise.
- Users may need SQL knowledge for advanced exploration.
- Infrastructure and administration responsibilities depend on the deployment approach.
Common Use Cases: Database dashboards, internal analytics, operational reporting, and custom business intelligence environments.
9. Metabase
Best for: Teams that want accessible database reporting and self-service analytics.
Metabase helps users ask questions about their data, create charts, and build dashboards. It has a visual query interface, and it also supports SQL for people who want more control over the analysis.
Key Features:
- Visual query builder.
- SQL editor.
- Charts and dashboards.
- Database connections.
- Filters and interactive reports.
- Dashboard sharing options.
Advantages:
- Provides a relatively accessible interface for data exploration.
- Offers an open-source edition.
- Supports both visual queries and SQL.
- Can help teams make database information easier to access.
Limitations:
- Database configuration may require technical assistance.
- Advanced analytics and administration can require additional knowledge.
- Available capabilities vary by deployment and plan.
Common Use Cases: Product analytics, sales dashboards, database reporting, customer metrics, and internal business reports.
10. Plotly
Best for: Developers and analysts who need interactive charts and programmatic visualizations.
Plotly provides charting tools and libraries for interactive visualizations. It supports several programming environments, including Python and JavaScript.
Plotly is useful when you need more control over how a visual looks and behaves than a standard dashboard interface provides.
Key Features:
- Interactive charts and graphs.
- Support for multiple programming languages.
- Statistical and scientific visualizations.
- Geographic charts and maps.
- Customizable chart layouts.
- Integration with application development workflows.
Advantages:
- Provides flexibility for custom visualizations.
- Supports interactive charts.
- Useful for technical and analytical projects.
- Can be integrated into web applications and analytical workflows.
Limitations:
- Some use cases require programming knowledge.
- Custom visualizations may take time to develop.
- Deployment and sharing depend on the selected Plotly product and environment.
Common Use Cases: Scientific data visualization, interactive research charts, financial analysis, and custom web-based data applications.
11. D3.js
Best for: Developers who need highly customized data visualizations for websites and applications.
D3.js is a JavaScript library for creating dynamic, data-driven visualizations in a web browser. It gives developers detailed control over how data is drawn and how visual elements respond to interaction.
Unlike a ready-made dashboard platform, D3.js is mainly a development library. It fits projects that need a custom visual experience rather than a standard business report.
Key Features:
- Custom charts and data graphics.
- Interactive visual elements.
- Data-driven document manipulation.
- Support for SVG, HTML, and CSS.
- Animations and dynamic visualizations.
- Integration with web development projects.
Advantages:
- Offers extensive customization.
- Useful for unique visual storytelling.
- Can create complex interactive visualizations.
- Works directly with web technologies.
Limitations:
- Requires JavaScript and web development knowledge.
- Visualizations often need to be built and maintained manually.
- It is not a ready-to-use business intelligence dashboard platform.
Common Use Cases: Interactive web graphics, custom dashboards, data journalism, public data stories, and specialized web applications.
12. Flourish
Best for: Interactive data storytelling and presentation-ready visualizations.
Flourish helps users create interactive charts, maps, and visual stories. It is useful when you want an engaging presentation without building every visual from code.
Key Features:
- Interactive charts and maps.
- Visual storytelling templates.
- Customizable presentation layouts.
- Data-driven animations and visual elements.
- Sharing and embedding options.
Advantages:
- Useful for creating engaging visual stories.
- Provides templates for different visualization formats.
- Can help non-developers present data visually.
- Supports interactive content for web publishing.
Limitations:
- It is more focused on visualization and storytelling than full business intelligence workflows.
- Advanced customization may require additional skills.
- Publishing and collaboration options depend on the selected plan.
Common Use Cases: Research presentations, public data stories, interactive reports, educational content, and media visualizations.
13. Grafana
Best for: Monitoring systems, infrastructure metrics, and time-series data.
Grafana is an analytics and monitoring platform. It visualizes metrics from databases, applications, infrastructure, and other supported data sources.
It is especially useful for technical teams that need to watch system performance, application health, and operational metrics over time.
Key Features:
- Real-time and time-series dashboards.
- Connections to supported monitoring and data sources.
- Custom panels and visualizations.
- Alerts and monitoring workflows.
- Dashboard sharing and organization.
- Open-source and hosted deployment options.
Advantages:
- Well suited to operational monitoring.
- Supports many data source integrations.
- Provides flexible dashboard customization.
- Offers open-source deployment options.
Limitations:
- It is not designed primarily for general business reporting.
- Data source configuration can require technical skills.
- Complex monitoring environments need careful dashboard and alert management.
Common Use Cases: Server monitoring, application performance, infrastructure analytics, operational dashboards, and time-series reporting.
14. Google Sheets
Best for: Collaborative spreadsheet reporting and basic data visualization.
Google Sheets is a cloud spreadsheet. Users can organize data, run calculations, create charts, and work in the same file together.
It is a practical option for people and teams that need simple visual reports and do not want a dedicated business intelligence platform.
Key Features:
- Built-in charts and graphs.
- Spreadsheet formulas and functions.
- Pivot tables and filters.
- Real-time collaboration.
- Integration with other Google Workspace applications.
- Sharing and access controls.
Advantages:
- Accessible through a web browser.
- Supports collaborative editing.
- Useful for simple reports and charts.
- Works with other Google Workspace tools.
Limitations:
- Complex dashboards may require other platforms.
- Large datasets can affect performance.
- Advanced visualization and data modeling options are more limited than specialized analytics platforms.
Common Use Cases: Team performance reports, survey analysis, budget charts, project tracking, and small business reporting.
15. Datawrapper
Best for: Clear charts, maps, and visual stories for publishing and communication.
Datawrapper helps users create charts, maps, and tables for websites, reports, and presentations.
It is especially useful for journalists, researchers, educators, and communication teams that want to present data clearly without building visuals from scratch.
Key Features:
- Charts, maps, and tables.
- Customizable visual styles.
- Responsive embedded visualizations.
- Data import and editing options.
- Publishing and sharing capabilities.
Advantages:
- Designed for clear data communication.
- Useful for publishing visual content online.
- Offers templates for common chart and map formats.
- Can be used without advanced programming knowledge.
Limitations:
- It is not a full business intelligence platform.
- Advanced analytical workflows may require other tools.
- Some publishing and customization features depend on the selected plan.
Common Use Cases: Research reports, journalism, educational content, public data communication, and website visualizations.
Data Visualization Tools Comparison: Features and Best Uses
A side-by-side view makes it easier to see which platform matches the work. The table below summarizes the main strength and typical skill level for each tool above.
| Tool | Best For | Key Strength | Technical Skill |
|---|---|---|---|
| Microsoft Power BI | Business intelligence | Interactive business dashboards | Beginner to advanced |
| Tableau | Visual analytics | Advanced visual exploration | Intermediate to advanced |
| Looker Studio | Web and marketing reports | Browser-based dashboards | Beginner to intermediate |
| Microsoft Excel | Spreadsheet reporting | Charts, PivotCharts, and formulas | Beginner to advanced |
| Qlik Sense | Interactive analytics | Associative data exploration | Intermediate to advanced |
| Zoho Analytics | Business reporting | Connected reports and dashboards | Beginner to intermediate |
| Domo | Enterprise analytics | Connected business data | Intermediate |
| Apache Superset | Open-source BI | SQL-based exploration | Intermediate to advanced |
| Metabase | Self-service analytics | Visual query building | Beginner to intermediate |
| Plotly | Interactive custom charts | Programmatic visualization | Intermediate to advanced |
| D3.js | Custom web graphics | Detailed visualization control | Advanced |
| Flourish | Data storytelling | Interactive visual stories | Beginner to intermediate |
| Grafana | System monitoring | Time-series dashboards | Intermediate to advanced |
| Google Sheets | Collaborative reporting | Simple charts and sharing | Beginner |
| Datawrapper | Publishing visualizations | Charts, maps, and tables | Beginner to intermediate |
Note: Technical skill levels are general guidance, not fixed requirements. Experience depends on the complexity of the data, the features being used, and the type of report being created.
Free vs. Paid Data Visualization Tools
Many platforms offer a free edition, an open-source version, a trial, or a paid subscription. The right option depends on the features you need, how many people will use it, your data requirements, and how you plan to share reports.
Free Data Visualization Tools
Free tools are a useful start for students, beginners, freelancers, and small teams. They let you learn visualization and build basic reports without taking a paid subscription right away.
Examples include:
- Google Looker Studio: Useful for browser-based reports and supported data connections.
- Microsoft Power BI Desktop: Provides report creation and analysis capabilities on a local computer, subject to product and sharing limitations.
- Google Sheets: Useful for basic spreadsheet charts and collaborative reporting.
- Apache Superset: An open-source platform for teams with the technical resources to deploy and maintain it.
- Metabase Open Source: Offers database exploration and dashboard capabilities in a self-managed environment.
- Tableau Public: Useful for public visualizations, but published work should not contain confidential information.
Paid Data Visualization Tools
Paid plans may add collaboration, administration, security, data connectivity, support, and enterprise features. Those matter when several teams need to access and manage reports.
Before purchasing a subscription, consider:
- How many people will create and view dashboards?
- Are sharing and collaboration features included?
- Are there limits on data sources, storage, or refresh frequency?
- Do you need advanced security and user permissions?
- Will the platform integrate with your existing systems?
- Are implementation, training, and maintenance costs involved?
Pricing and plan features change over time. Check the software provider's official pricing page for current rates, regional availability, licensing requirements, and plan limitations before you buy.
How AI Is Changing Data Visualization
AI is making some visualization workflows easier to reach. Instead of setting up every chart by hand or writing every query, a user can describe a question in everyday language and get help with the analysis or the visual.
AI features vary by platform and subscription. Common uses include:
1. Natural-Language Queries
Some platforms let you ask a question in everyday language. A user might ask, "Which product generated the highest sales last quarter?" The platform may help generate a query, a chart, or an analytical response.
2. Automated Chart Suggestions
AI features can recommend a visual format from the selected data and the question. That can help you choose among bar charts, line charts, tables, and other formats.
3. Faster Data Exploration
AI tools can help you look for patterns, summarize information, and explore possible relationships in a dataset. Analysts should still check the results and understand how the underlying data was processed.
4. Dashboard Assistance
Some platforms use AI to help create reports, write summaries, or flag changes in business metrics. That can cut repetitive work. It does not replace accurate data or human review.
5. Automated Insights and Anomaly Detection
AI-supported analytics can flag unusual changes or patterns that need a closer look. A dashboard might highlight a sudden drop in sales or an unexpected rise in website traffic.
AI can make visualization faster. Analysts still need to check data quality, validate calculations, and make sure the conclusion is supported by evidence.
Real-World Use Cases of Data Visualization Tools
Teams use these tools across industries to show performance, find trends, and support operational decisions. Here are common examples.
1. Marketing and SEO
Marketing teams use dashboards to watch website traffic, keyword performance, campaign engagement, lead generation, and conversion rates. The reports help them compare campaign results and see what needs to improve.
2. Finance and Accounting
Finance teams use charts and dashboards to track revenue, expenses, profit margins, cash flow, and budgets. The visuals make it easier to compare performance across reporting periods.
3. Sales and Customer Analytics
Sales teams can watch monthly targets, conversion rates, customer acquisition, and product performance. Customer dashboards can also show purchasing patterns and changes in customer behavior.
4. Healthcare
Healthcare organizations can use visual reports to monitor patient volumes, appointment trends, resource use, and operational performance. Sensitive health information must be handled according to the privacy and security rules that apply.
5. Education
Schools and colleges can show enrollment, attendance, course completion, student progress, and learning outcomes. The reports help administrators see trends and plan resources.
6. Operations and Supply Chain
Operations teams use dashboards to watch inventory, delivery times, production performance, supplier activity, and process efficiency. The visuals can show bottlenecks and support planning.
How to Choose the Right Data Visualization Tool
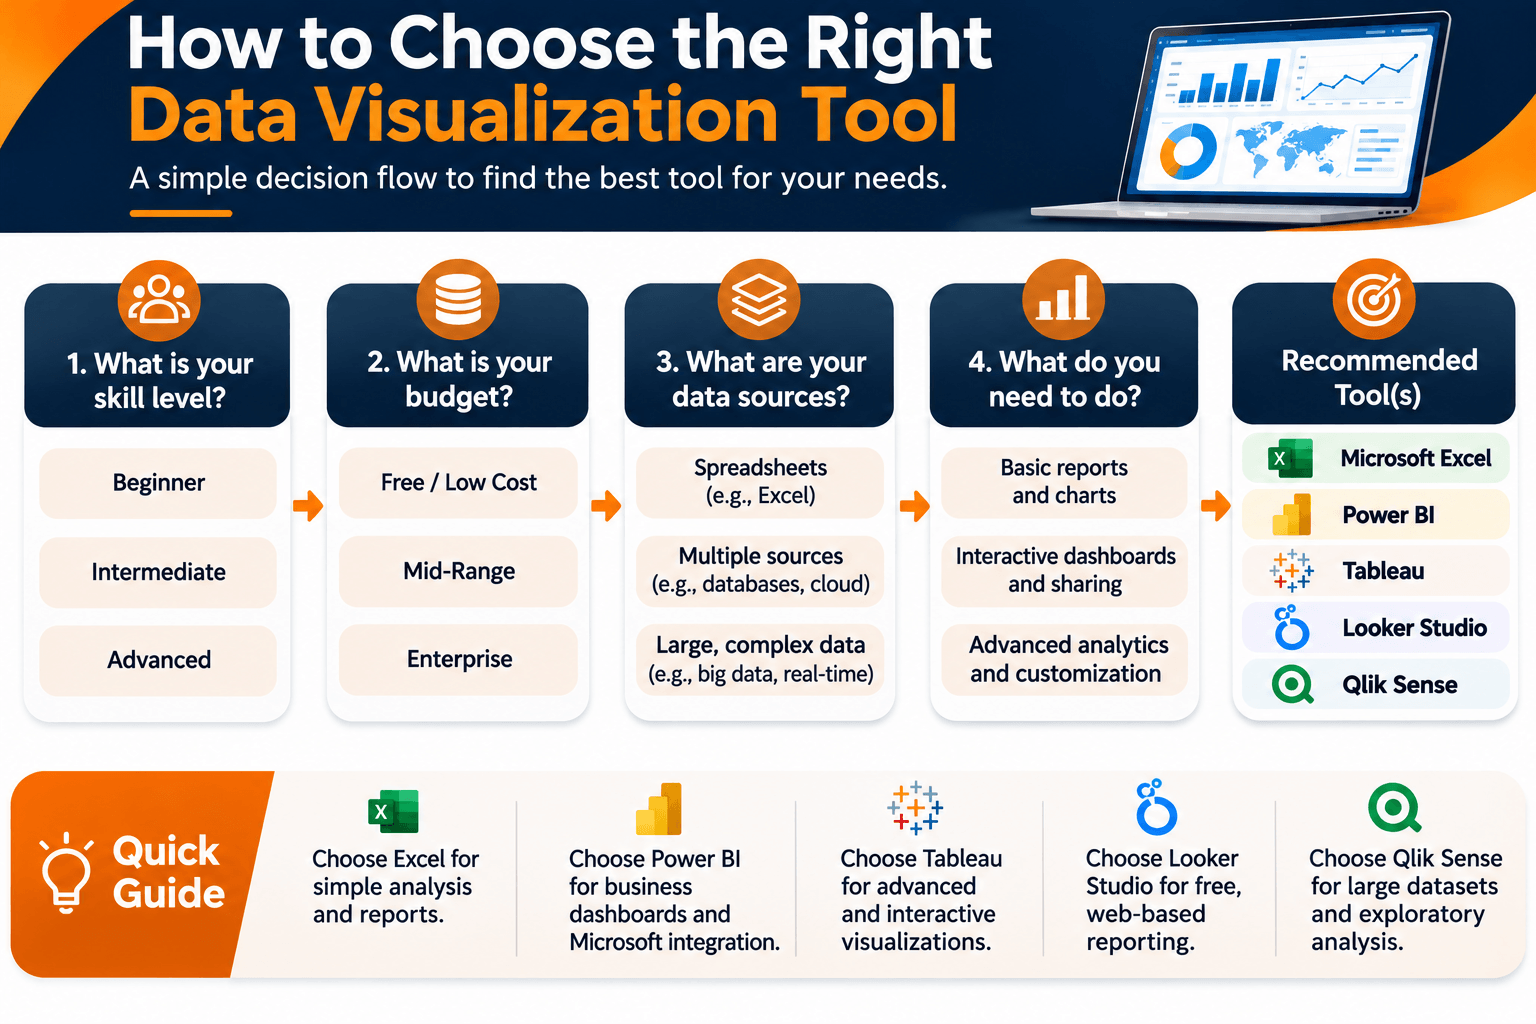
Start with the reporting goal, not the feature list on a product page. A simple spreadsheet chart may be enough for one project. A larger organization may need a dedicated business intelligence environment.
1. Identify Your Reporting Requirements
Decide what you need to create: simple charts, interactive dashboards, real-time monitoring, executive reports, or custom visuals for a website.
2. Evaluate Your Data Sources
Check whether the platform supports the databases, spreadsheets, cloud services, and business applications you already use. A reliable data connection matters for accurate reporting.
3. Consider Your Technical Skills
Beginners may prefer a visual interface and ready-made templates. Analysts may need data modeling and calculations. Developers may prefer libraries they can use to build custom visuals.
4. Compare Features and Flexibility
Review chart types, dashboard customization, filtering, collaboration, data transformation, and export options. Choose features that support the actual work, rather than paying for capabilities you may never use.
5. Review Pricing and Licensing
Compare subscription cost, user limits, sharing requirements, and extra charges for connectors or advanced features. Include the total cost of using and maintaining the platform.
6. Check Security and Data Governance
If the organization works with sensitive business or customer information, review access controls, authentication, hosting, data retention, and compliance requirements before you choose a platform.
7. Test the Platform Before Committing
Where a free edition, trial, or sample project is available, use it. Build a small dashboard with your own data and check usability, performance, and whether the reports do what you need.
Common Mistakes to Avoid in Data Visualization
Strong visualization software cannot rescue an unclear or misleading report. How you select and present the information matters as much as the tool.
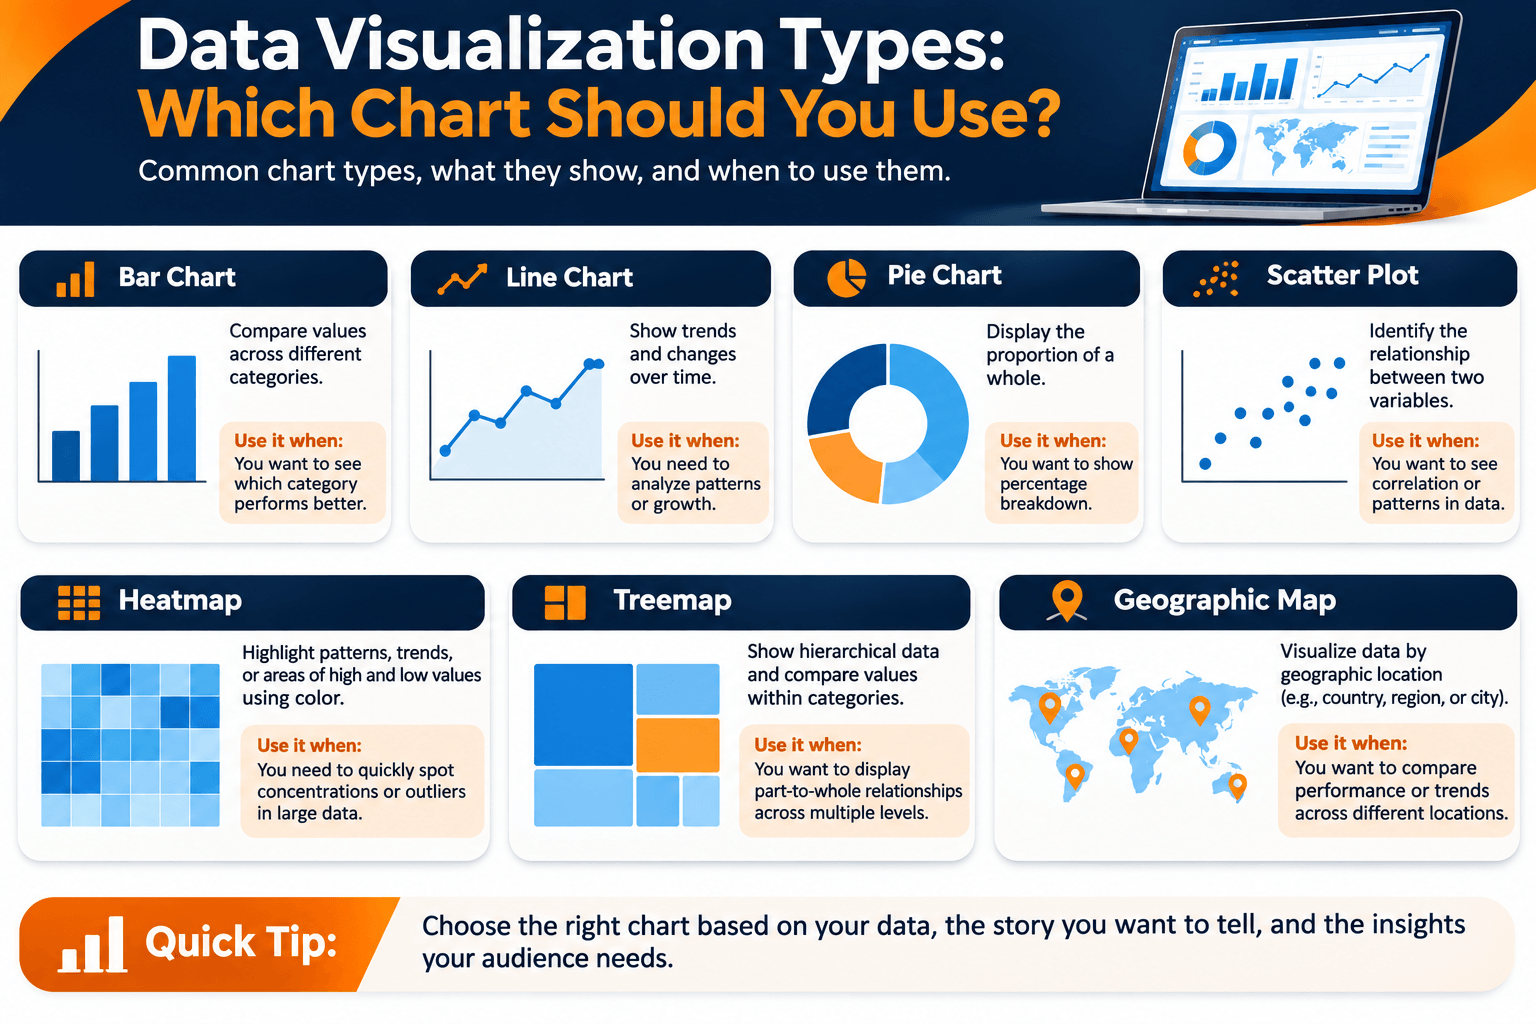
- Using the wrong chart type: Select a chart that matches the data and the question you want to answer.
- Adding too much information: Overloaded dashboards can make important findings difficult to identify.
- Ignoring data quality: Inaccurate, incomplete, or duplicated data can lead to misleading visual reports.
- Using confusing colors: Apply consistent colors and make sure the chart remains easy to read.
- Leaving out context: Include clear titles, labels, units, time periods, and relevant comparisons.
- Misrepresenting data: Avoid misleading scales, incomplete comparisons, and visual choices that exaggerate differences.
- Ignoring the audience: Design reports around the knowledge and needs of the people who will use them.
Frequently Asked Questions About Data Visualization Tools
1. What are the best data visualization tools?
Widely used tools include Microsoft Power BI, Tableau, Google Looker Studio, Microsoft Excel, Qlik Sense, Zoho Analytics, and Apache Superset. The best option depends on your data sources, reporting needs, technical skills, and budget.
2. Which data visualization tool is best for beginners?
Microsoft Excel, Google Sheets, and Google Looker Studio are useful starting points. They have accessible interfaces for charts and basic reports. The best choice still depends on the data and the reporting task.
3. What are some free data visualization tools?
Examples include Google Looker Studio, Google Sheets, Microsoft Power BI Desktop, Apache Superset, Metabase Open Source, and Tableau Public. Each has different features and limits, so check the current terms and sharing options before you use it.
4. What is the difference between Power BI and Tableau?
Power BI is a business intelligence platform that fits closely with Microsoft's ecosystem and includes reporting and data modeling. Tableau is known for interactive visual exploration and flexible dashboards. The right choice depends on your existing technology, analytical needs, licensing, and team skills.
5. Are data visualization tools used in data analytics?
Yes. Data visualization is part of data analytics. Analysts use charts, graphs, and dashboards to explore datasets, explain findings, monitor performance, and support business decisions.
6. What is the difference between data visualization tools and business intelligence tools?
Data visualization tools focus on presenting information through charts, maps, and dashboards. Business intelligence platforms often go further, with data integration, preparation, analysis, reporting, and visualization. Many current tools combine both.
7. Can AI create data visualizations?
Yes. Some AI-enabled platforms can help with chart suggestions, natural-language queries, dashboard summaries, and data exploration. Users should still check the source data, the calculations, and the conclusions before relying on an AI-generated result.
8. Which data visualization tool is best for business dashboards?
Microsoft Power BI, Tableau, Qlik Sense, Zoho Analytics, and Domo are examples of platforms used for business dashboards. The best option depends on the organization's data sources, reporting requirements, user permissions, and budget.
9. Do I need coding skills to use data visualization tools?
No. Many platforms have visual interfaces and templates, so you can build charts and dashboards without programming. Coding helps when you build custom visuals with D3.js or use Plotly in an analytical application.
10. What skills are needed to work with data visualization tools?
Useful skills include data cleaning, spreadsheet analysis, chart selection, basic statistics, dashboard design, data interpretation, and communication. Depending on the platform, SQL, programming, and data modeling can also help.
Build Your Data Visualization and Analytics Skills with WorkForce Institute
Learning data visualization tools is one step toward working as a data analyst. A useful dashboard also takes data preparation, analysis, interpretation, and a clear business question behind the report. The Generative AI Data Analyst program at WorkForce Institute covers those skills in an instructor-led format, including how modern tools and AI support analytical work.
If a fixed schedule does not fit, the self-paced Generative AI Data Analyst program covers the same ground on a timeline you set yourself. Either way, the aim is to turn raw information into visuals people can understand and use.