Excel Charts and Graphs: Types, Examples, and How to Create Them
A large spreadsheet makes it hard to see a pattern, compare results, or tell how the business is doing. Microsoft Excel can turn those numbers into charts and graphs that are easier to read.
You might want to compare monthly sales, track growth, look at customer trends, or present marketing results. A chart can turn the spreadsheet into something people can actually use.
This guide covers how to make a graph in Excel, the main chart types, when to use each one, and practical examples you can follow.
1. What Are Charts and Graphs in Excel?
Charts and graphs in Excel are pictures of spreadsheet data. They show numbers as bars, lines, columns, slices, and points, so the information is easier to see.
You do not have to scan hundreds of rows. A chart makes the important patterns and comparisons stand out.
A business might track monthly revenue in Excel. The sheet can hold a sales figure for every month. A line chart makes it easier to see whether revenue is rising, falling, or staying flat.
Excel charts are commonly used for:
- Comparing sales performance across products or regions.
- Tracking revenue, expenses, and profit over time.
- Analyzing customer growth and business performance.
- Monitoring marketing campaign results.
- Presenting financial and operational reports.
- Identifying patterns and trends in datasets.
Charts are also part of data visualization. If you want to see how businesses use visuals to understand information, read WFI's guide to five data visualization methods for gaining insights from company data.
2. Types of Charts and Graphs in Excel
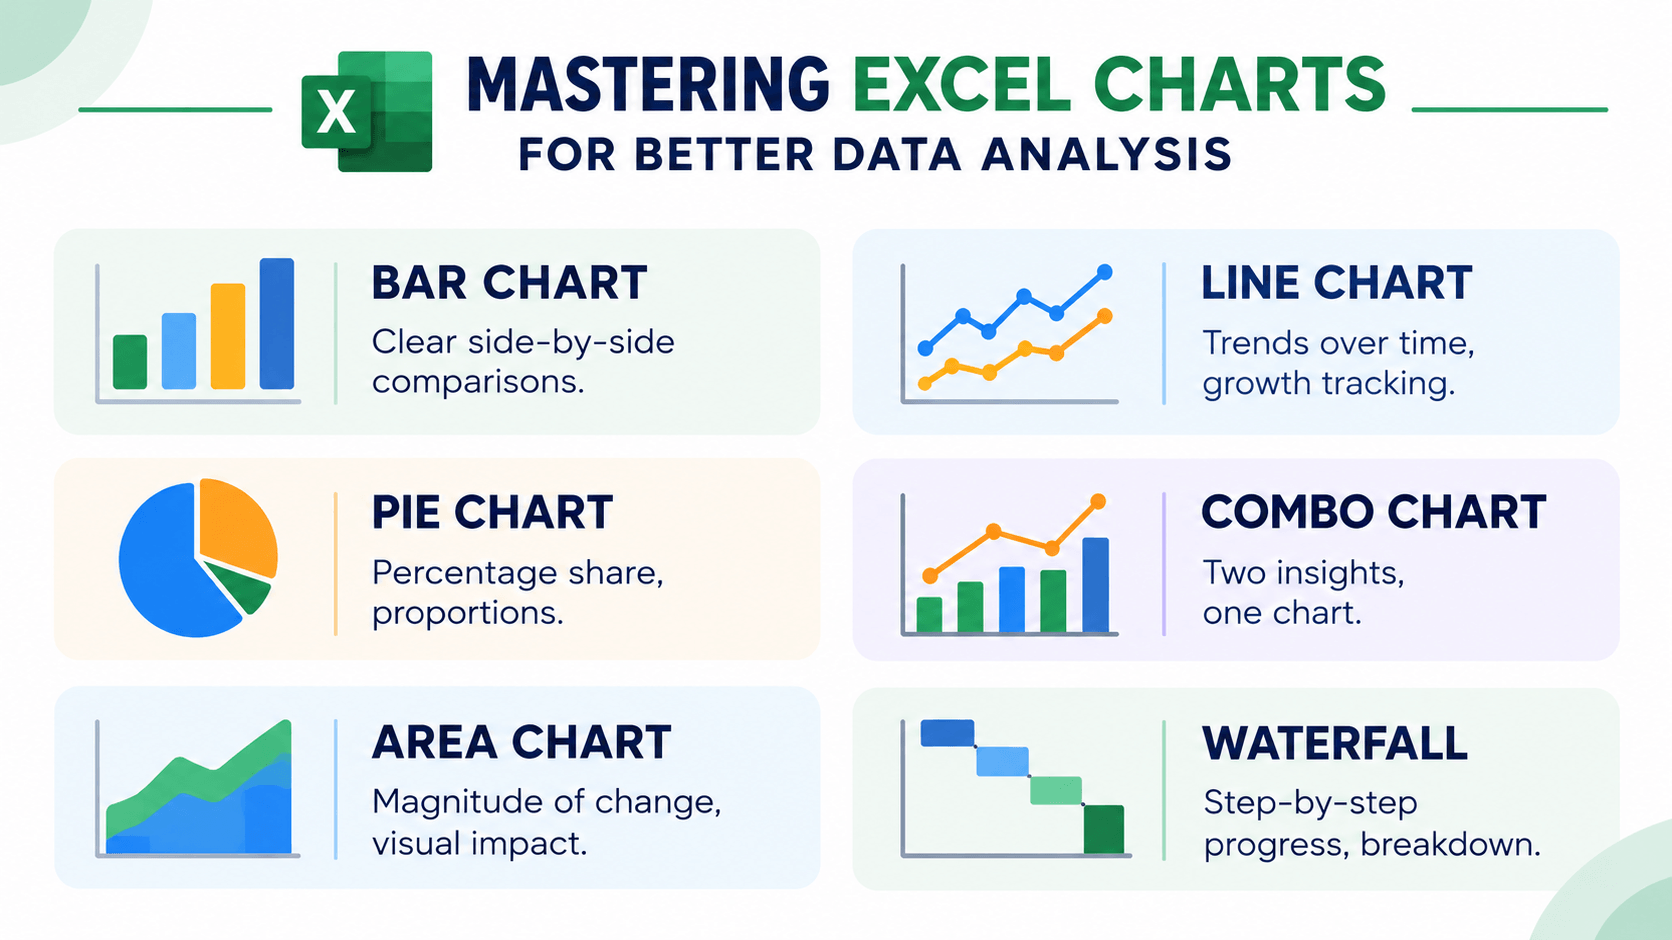
Microsoft Excel includes several chart types, and each one is built for a different job. The right choice depends on what you want to show and how the values relate to each other.
1. Column Charts
Column charts use vertical bars to compare values across categories. They work well when you want to compare sales, revenue, expenses, or other measurements across products, departments, or time periods.
Example: A retail company can use a column chart to compare monthly sales across product categories.
Best used for: Comparing values across categories or periods.
2. Bar Charts
Bar charts use horizontal bars. They are especially useful when category names are long, or when you need to compare several categories at once.
Example: A company can compare the sales performance of ten products with a horizontal bar chart.
Best used for: Comparing multiple categories and ranking values.
3. Line Charts
Line charts connect data points to show change over time. People use them to spot trends, patterns, and swings.
Example: A business can use a line chart to track monthly revenue through the year and see seasonal changes.
Best used for: Tracking trends over time and comparing changes across periods.
4. Pie Charts
Pie charts split a circle into slices to show how each category contributes to a total. Each slice is a share of the whole dataset.
Example: A marketing team can use a pie chart to show how its advertising budget is split across channels.
Best used for: Showing simple proportions or percentage breakdowns with a small number of categories.
5. Doughnut Charts
Doughnut charts are similar to pie charts, with a blank center. They show how categories contribute to a whole, and they can hold more than one data series.
Example: A business can use a doughnut chart to show the percentage of revenue each department generates.
Best used for: Showing proportions and category contributions.
6. Scatter Charts
Scatter charts plot individual points from two numerical variables. They help you look for a relationship, a pattern, or a possible correlation, and they make outliers easier to spot.
Example: A company can use a scatter chart to explore the relationship between advertising spend and sales revenue.
Best used for: Exploring relationships between two numerical variables and identifying outliers.
7. Area Charts
Area charts fill the space under a line to show how values change over time. They can also show how different categories add up to a total.
Example: A business can use an area chart to show monthly revenue from different product categories.
Best used for: Showing trends and changes in totals over time.
8. Combo Charts
Combo charts put two or more chart types in one visual. They help when you need to compare measurements that use different scales.
Example: A company can show monthly revenue as columns and profit margin as a line on the same chart.
Best used for: Comparing related metrics with different measurement scales or emphasizing different data relationships.
3. How to Choose the Right Excel Chart
The chart you pick matters, because each one answers a different kind of question. A chart that works for a trend can be a poor way to show a proportion.
Use the following table as a quick reference when selecting a chart in Excel.
| Chart Type | Purpose | Example |
|---|---|---|
| Column Chart | Compare values across categories | Monthly product sales |
| Bar Chart | Compare or rank categories | Top-selling products |
| Line Chart | Show trends over time | Annual revenue growth |
| Pie Chart | Show parts of a whole | Marketing budget distribution |
| Doughnut Chart | Show proportions | Revenue by department |
| Scatter Chart | Explore relationships between variables | Advertising spend and sales |
| Area Chart | Show trends and cumulative values | Revenue contribution over time |
| Combo Chart | Compare different metrics together | Revenue and profit margin |
Before you choose, ask what question the chart should answer. Are you comparing categories, tracking change over time, showing proportions, or looking for a relationship? That answer points you to the right chart.
4. How to Make a Graph in Excel: Step-by-Step Guide
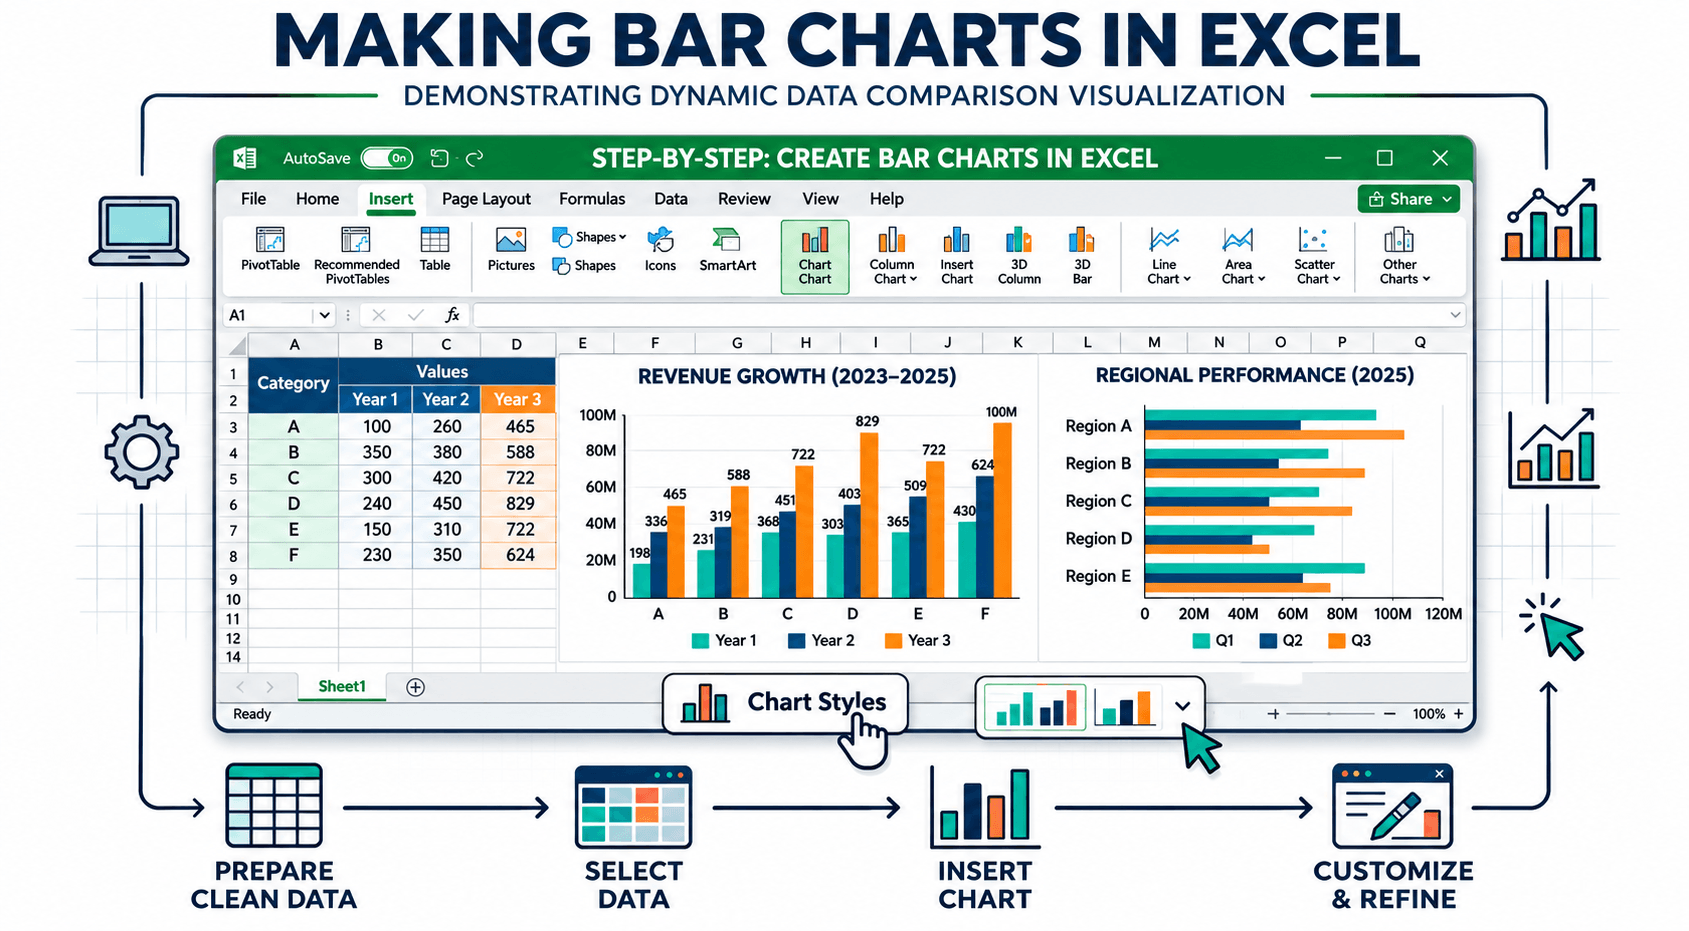
Making a graph in Excel is straightforward once the data is organized. These steps turn a spreadsheet into a useful chart.
Step 1: Prepare Your Data
Organize the information into rows and columns. Use clear headings so Excel can tell the categories from the values.
For example, consider the following monthly sales dataset:
| Month | Sales ($) |
|---|---|
| January | 5,000 |
| February | 6,200 |
| March | 5,800 |
| April | 7,100 |
| May | 8,000 |
| June | 9,200 |
Do not leave blank rows or columns inside the range you select. Check that the numbers are stored as numbers, not as text.
Step 2: Select Your Data
Highlight the cells you want to chart, including the column headings. In the example above, select the Month and Sales columns.
Including headings helps Excel identify the categories and series when it creates the chart.
Step 3: Open the Insert Tab
Go to the Insert tab in the Excel ribbon. You will find chart options for column, bar, line, pie, and scatter charts.
Step 4: Choose a Chart Type
Pick the chart that best represents the data. Choose a line chart if you want to show how sales change from January to June.
You can also select Recommended Charts to see suggestions based on the dataset you selected.
Step 5: Customize Your Chart
After the chart is inserted, Excel lets you change how it looks. Depending on your Excel version and the chart type, you can:
- Add or edit the chart title.
- Display data labels and axis titles.
- Change chart colors and styles.
- Show or hide the legend.
- Adjust axis formatting and number display.
- Move or resize the chart within the worksheet.
Step 6: Review and Save Your Chart
Check that the chart matches the data. Labels should be readable, the values should be correct, and the chart should say what you meant it to say.
Save the workbook so you can update the chart when the underlying data changes.
5. How to Create Different Graphs in Excel
Each chart type needs a slightly different selection and a bit of formatting. These three are common starting points.
How to Make a Bar Graph in Excel
A bar graph is useful when you are comparing values across several categories.
- Enter your categories and corresponding numerical values in Excel.
- Select the complete data range, including headings.
- Open the Insert tab.
- Choose Insert Column or Bar Chart.
- Select the horizontal bar chart style you prefer.
- Add a title and data labels if they improve readability.
The chart shows each category as a horizontal bar, which makes the values easier to compare.
How to Make a Line Graph in Excel
A line graph is useful for tracking change over time, such as monthly sales, website traffic, or customer growth.
- Organize your dates or time periods in one column.
- Enter the corresponding values in the next column.
- Select the data range.
- Go to Insert and choose Insert Line or Area Chart.
- Select a suitable line chart style.
- Add a chart title and format the axes.
The chart connects the data points so you can see whether the trend is moving up or down.
How to Create a Pie Chart in Excel
A pie chart is useful for showing how each category contributes to a total.
- Enter category names and their corresponding values.
- Select the category and value columns.
- Open the Insert tab.
- Choose Insert Pie or Doughnut Chart.
- Select a two-dimensional pie chart.
- Add data labels or percentages to explain each slice.
For a chart people can actually read, keep the number of categories small and make sure the values are parts of the same total.
6. Excel Chart Examples for Data Analysis
Excel charts show up across industries because they help people see how the business is doing and explain what they found. Here are some practical examples.
Example 1: Monthly Sales Performance
A sales team can use a line chart to track revenue over several months. Growth, seasonal swings, and months when sales drop are easier to see.
Example 2: Product Sales Comparison
A retail company can use a bar chart to compare how different products sold. Managers can see the top products and the categories that need attention.
Example 3: Marketing Campaign Performance
A marketing team can use column charts to compare campaigns across channels. Clicks, leads, conversions, and campaign costs can each be shown in their own chart.
Example 4: Customer Growth Trends
A business can use a line chart to track new customers each month. That shows whether acquisition is changing and whether marketing activity had an effect.
Example 5: Revenue Distribution
A company can use a doughnut or pie chart to show how departments, product categories, or business units contribute to total revenue.
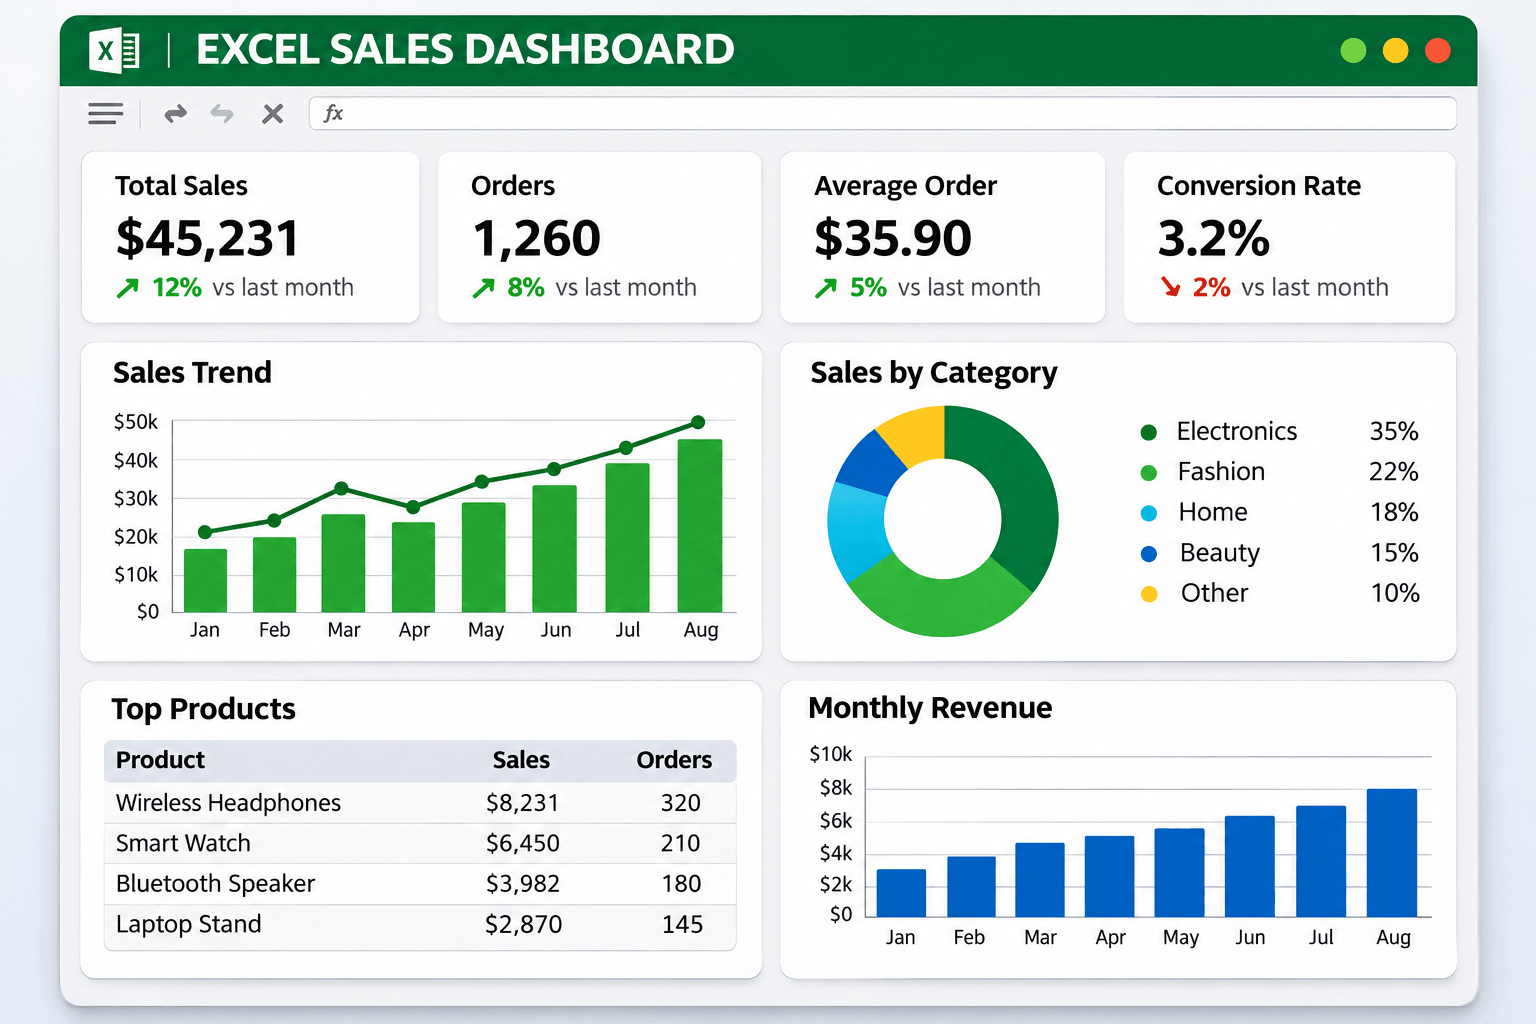
These are everyday uses. For more advanced reporting and interactive visuals, some businesses also use Power BI. You can look at practical dashboard examples in WFI's guide to Power BI dashboards once that article is published.
7. Tips for Creating Effective Excel Charts
A good chart should make the information easier to understand. Keep these points in mind when you create charts and graphs in Excel.
Choose the Right Chart Type
Match the chart to the question. Use line charts for trends, bar charts for comparing categories, and pie charts for simple proportions.
Use Clear Chart Titles
Write a title that says what the chart shows. "Monthly Sales Revenue" tells people more than a generic heading such as "Chart 1."
Avoid Unnecessary Visual Elements
Too many colors, labels, gridlines, and decorations make a chart harder to read. Keep the design simple and focus on the information that matters.
Label Data Clearly
Use readable axis titles, legends, and data labels where they help. Viewers should be able to tell the units and the categories.
Check Your Data Accuracy
Check the selected range and the values before you present a chart. Wrong or incomplete data leads people to the wrong conclusion.
Consider Your Audience
A chart for a technical team can carry more detail than one for executives or customers. Match the level of detail to the people who will use it.
8. Common Mistakes to Avoid When Creating Excel Charts
A tidy spreadsheet can still produce a confusing chart if the chart type or the formatting is wrong.
- Choosing the wrong chart type: A pie chart is not ideal for showing changes over time, while a line chart may not be the best choice for comparing unrelated categories.
- Using too many categories: Too many slices or data series can make a chart difficult to read.
- Ignoring labels: Missing titles, units, or category labels can make the information unclear.
- Using misleading scales: Axis settings can exaggerate or minimize differences between values.
- Overusing colors: Too many colors can distract viewers from the main message.
- Using incomplete data: Selecting the wrong range can leave important information out of the chart.
Checking these details before you share a chart helps keep it accurate, readable, and useful.
9. How Excel Charts Support Data Analysis
Excel charts are more than a way to present numbers. Analysts use them to explore information, spot patterns, and explain findings to the people who make decisions.
An analyst reviewing monthly sales might notice that revenue rises in certain periods. A chart makes that pattern easier to see and easier to investigate.
Creating the chart is only part of the work. Analysts also need to prepare the data, check it, interpret the results, and connect the findings to a business goal.
As the tools change, more professionals are using AI to help with data preparation, reporting, and finding insights. Read WFI's article on the strategic evolution of the data analyst and the growing role of generative AI to see how the profession is changing.
Excel is often a useful place to start learning data analysis. As projects get more complex, people also work with SQL, Power BI, Python, and other analytical tools.
10. Build Your Data Analysis Skills with WorkForce Institute
Learning how to create charts and graphs in Excel is a practical first step. Becoming an effective data analyst also takes technical skill, analytical thinking, and problem-solving.
WorkForce Institute offers two learning options for professionals who want to develop their data analysis capabilities:
Generative AI Data Analyst Bootcamp
The Generative AI Data Analyst Bootcamp is for learners who want a structured, instructor-led experience. Explore the program to see the curriculum, the learning format, and the practical data analytics focus.
Self-Paced Generative AI Data Analyst Program
If you prefer to learn on your own schedule, look at the Self-Paced Generative AI Data Analyst Program. It is a more flexible way to approach the same kind of study.
To see how learners can build their skills and move toward a data analyst career, read WFI's roadmap to becoming a data analyst with generative AI.
11. Frequently Asked Questions About Excel Charts and Graphs
How do I make a graph in Excel?
Organize the data into rows and columns, select the range, open the Insert tab, and choose a chart type. You can then change the title, labels, colors, and other formatting.
What are the most commonly used chart types in Excel?
The common ones are column, bar, line, pie, doughnut, scatter, area, and combo charts. Each one is built to show a different kind of information.
Which Excel chart is best for comparing data?
Bar and column charts are the usual choice for comparing values across categories. Bar charts help when the category names are long or when you want to rank several items.
Which chart is best for showing trends over time?
A line chart is usually the right choice for a trend over time. It makes increases, decreases, and swings easier to see.
Can I create a graph in Excel automatically?
Yes. Recommended Charts suggests chart types based on the data you selected. You can review the suggestions and pick the one that communicates the information best.
Can Excel charts update automatically when data changes?
A chart usually updates when the data it references changes. If the dataset keeps growing, using an Excel Table as the source can help the chart include new rows, depending on how the chart is set up.
Is Excel enough for data analysis?
Excel is useful for organizing data, running calculations, making charts, and doing many kinds of analysis. More complex projects may also need SQL, Power BI, Python, or a specialized analytics platform.
What is the difference between a chart and a graph in Excel?
In Excel, people often use chart and graph to mean the same thing. Both are visual representations of data. Some chart types are built for a specific job, such as showing proportions or the relationship between two sets of numbers.
Conclusion
Excel charts and graphs make data easier to understand, patterns easier to spot, and findings easier to explain. Excel covers simple bar and line charts and more advanced scatter and combo charts, so you can match the visual to the question.
Learning how to make a graph in Excel is a useful skill for students, working professionals, and people aiming to become data analysts. Pick the right chart, organize the data carefully, and present it clearly, and a spreadsheet becomes something people can act on.
As your skills grow, you can move past spreadsheets into broader analysis tools and AI-supported workflows. Practice, plus the right learning, is how you get better at using data in real business work.