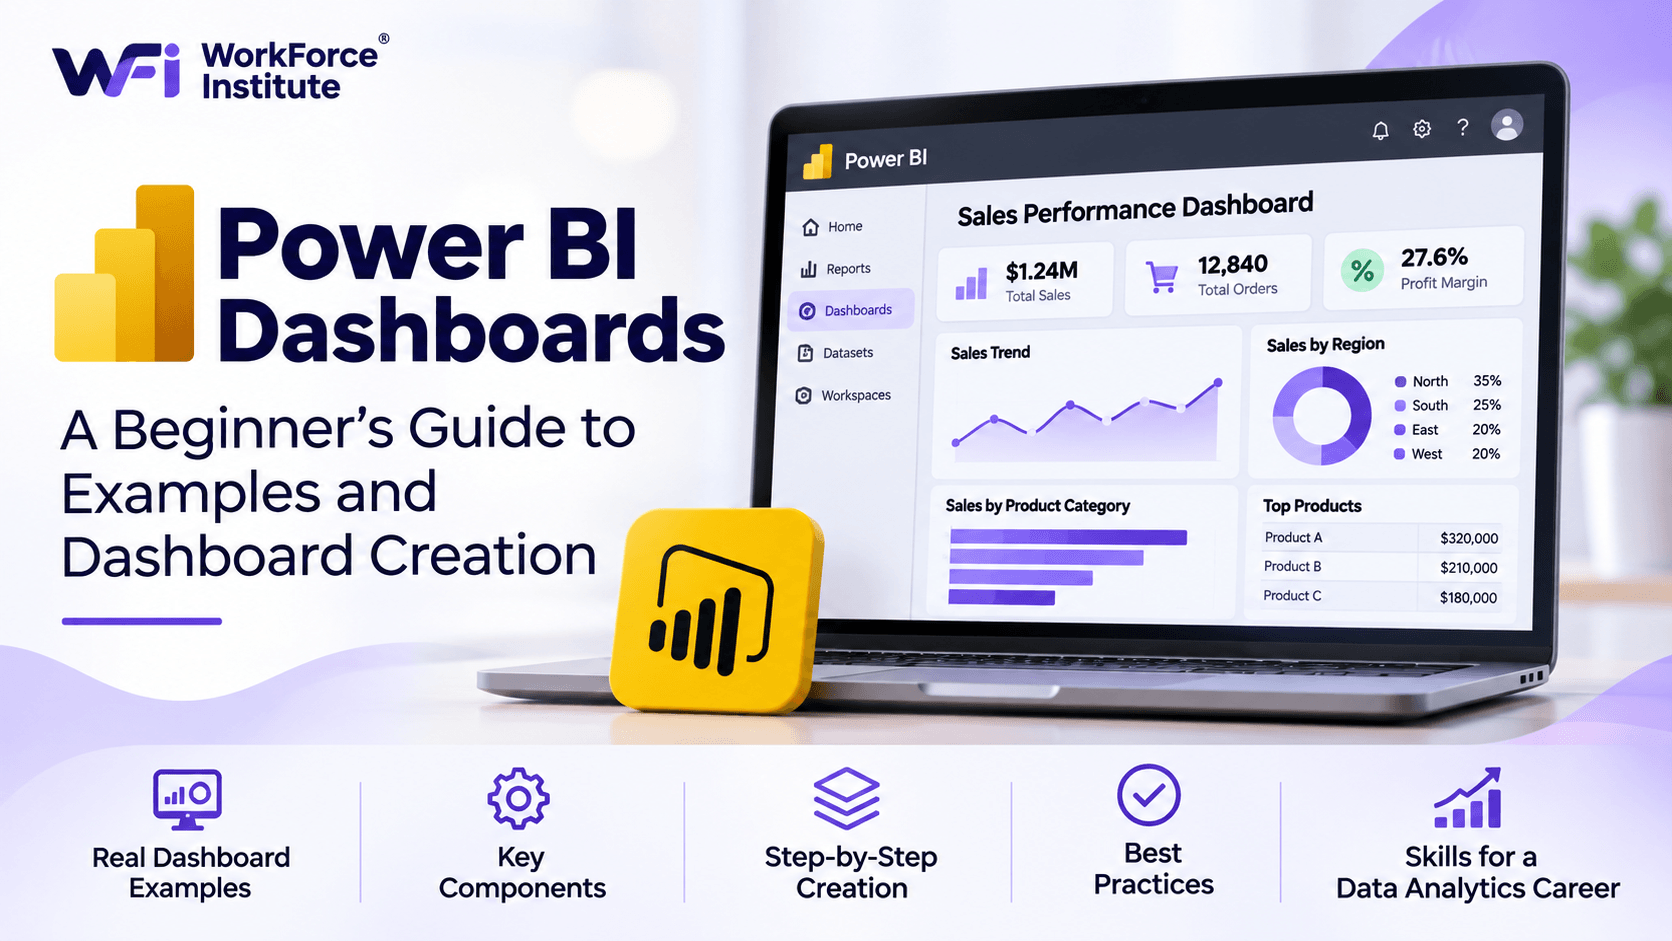
A Power BI dashboard turns a pile of numbers into a picture people can actually use. Instead of opening several spreadsheets and comparing reports by hand, a team can watch the metrics that matter, see a trend, and decide.
If you want to work as a data analyst, building one is a skill worth practicing. You clean the data, choose the visuals, think through what the numbers mean, and explain them to someone else.
This guide covers what a Power BI dashboard is, five examples you will actually see at work, the pieces that make one useful, and a beginner path for building your first one.
What Is a Power BI Dashboard?
A Power BI dashboard is one page that sums up the business with charts, graphs, numbers, and other visuals.
People use it to watch key performance indicators (KPIs), see how the business is doing, and notice patterns without reading through rows of raw data.
For example, a sales dashboard might display:
- Total revenue generated.
- Number of products sold.
- Monthly sales performance.
- Top-performing products.
- Sales by region.
- Revenue compared with previous periods.
Microsoft Power BI lets you pull data from different sources and put the important numbers in one view.
A dashboard and a report are not the same thing. A report can run across several pages and include interactive visuals. A dashboard is a single page of visuals, called tiles, and you build it in Power BI Service.
What Is Power BI Used For?
Power BI is a business intelligence and data visualization tool. Companies use it to study information, see how operations are going, and support a decision.
1. Sales Performance Analysis
Sales teams use dashboards to watch revenue, compare results with targets, see which products are selling, and track people or regions.
2. Financial Reporting
Finance teams use them to watch expenses, revenue, profit margins, budgets, and how those numbers move over time.
3. Marketing Analytics
Marketing teams look at campaign results, website traffic, leads, conversion rates, and how customers engage.
4. Human Resources Analytics
HR teams track turnover, hiring, workforce demographics, attendance, and whether people stay.
5. Operational Monitoring
Operations teams watch inventory, production, delivery times, and how efficiently the work is running.
Used this way, the data is not just stored. It helps people decide.
5 Practical Power BI Dashboard Examples
Seeing a few dashboard types makes it easier to understand how visuals support real work. These five come up often.
1. Sales Dashboard
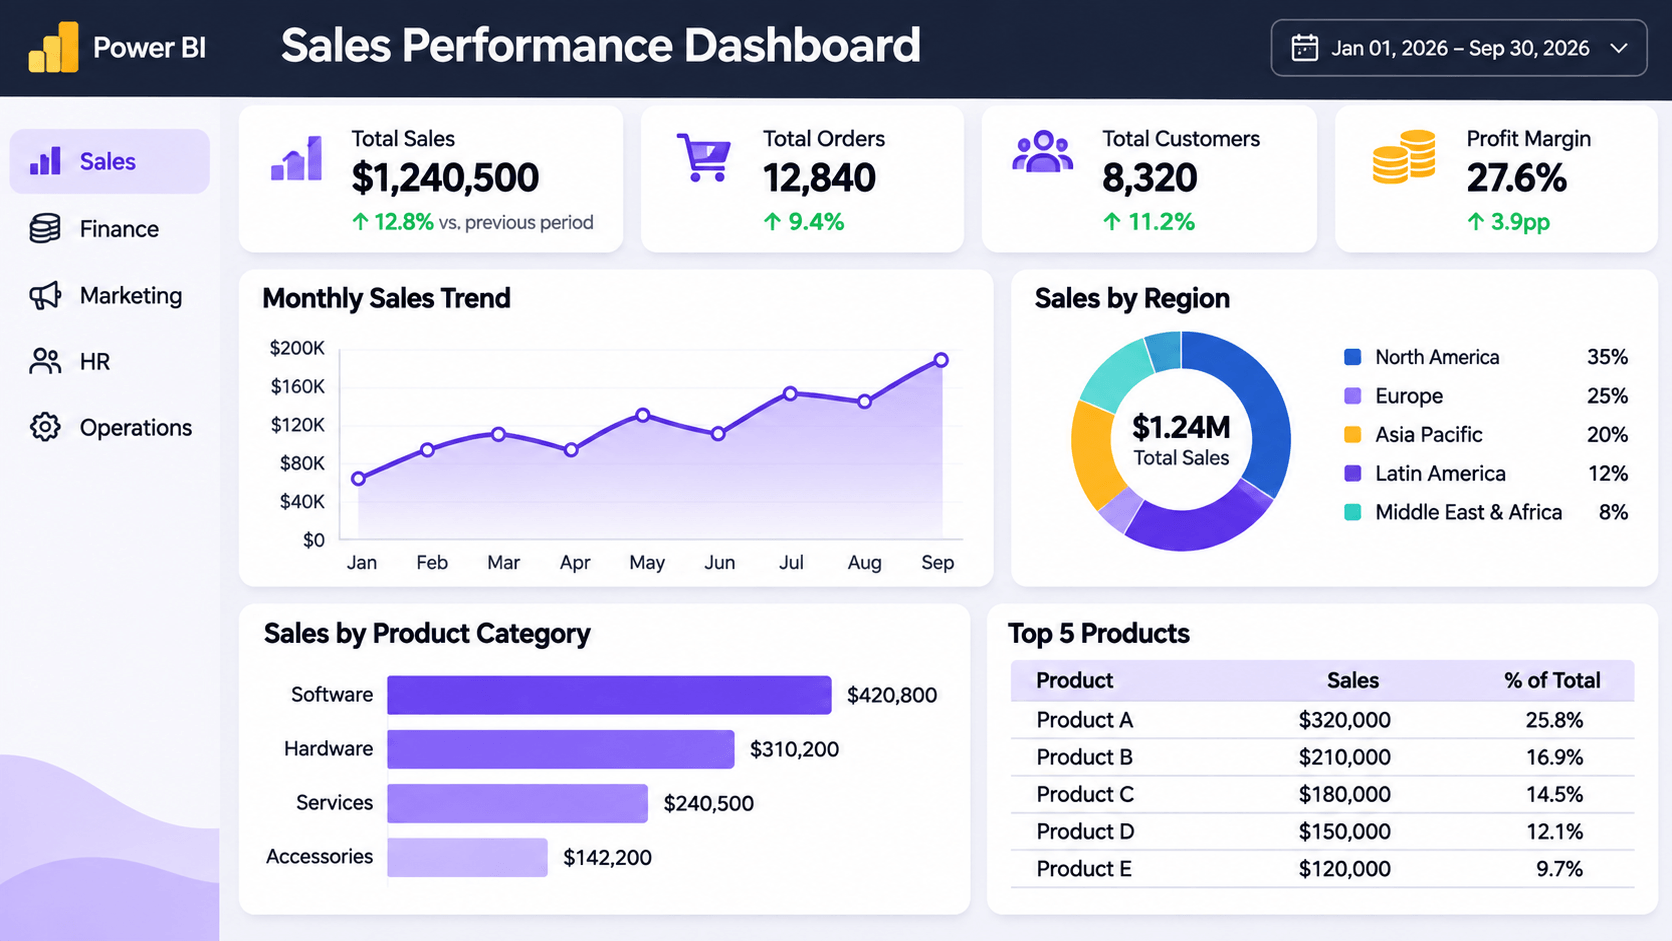
A sales dashboard shows how sales are going.
It can include:
- Total sales revenue.
- Monthly sales trends.
- Revenue by product.
- Sales by region.
- Sales targets versus actual performance.
- Top-performing sales representatives.
Business benefit: A sales manager can see which products are doing well, whether targets are on track, and where performance needs work.
2. Financial Dashboard
A financial dashboard puts the main money metrics in one place.
Common elements include:
- Total revenue.
- Operating expenses.
- Net profit.
- Profit margins.
- Budget versus actual spending.
- Cash flow trends.
Business benefit: Finance can see whether the business is healthy, spot an expense that looks off, and compare spending with the budget.
3. Marketing Dashboard
A marketing dashboard shows how campaigns and channels are performing.
It may display:
- Website traffic.
- Lead generation.
- Conversion rates.
- Cost per lead.
- Campaign performance.
- Social media engagement.
Business benefit: Marketers can see which campaigns worked and decide where the budget should go next.
4. HR Dashboard
An HR dashboard shows how the workforce is changing.
It can include:
- Total employee count.
- Employee turnover rate.
- New hires.
- Recruitment performance.
- Department-wise employee distribution.
- Employee attendance.
Business benefit: HR can watch those trends and see where hiring or retention needs attention.
5. Customer Analytics Dashboard
A customer analytics dashboard shows how customers behave and how engaged they are.
Typical metrics include:
- Total customers.
- New versus returning customers.
- Customer retention.
- Customer acquisition.
- Customer satisfaction.
- Purchase patterns.
Business benefit: The business can understand its customers better and find places to improve the experience.
Key Components of an Effective Power BI Dashboard
A useful dashboard is easy to read. It is not a page packed with every chart you can make. These pieces keep the information organized.
1. Key Performance Indicators (KPIs)
KPIs are the numbers you use to judge how the business is doing. Total revenue, conversion rate, customer retention, and monthly sales growth are common examples.
A card visual in Power BI puts those numbers up front, so someone can see performance quickly.
2. Charts and Graphs
Charts help people see a pattern or compare values. Common visualizations include:
- Bar charts: Useful for comparing categories.
- Line charts: Useful for showing trends over time.
- Column charts: Useful for comparing values across categories.
- Pie charts: Useful for displaying simple part-to-whole relationships.
- Tables: Useful for presenting detailed information.
Pick the chart that fits the data and the question you are trying to answer.
3. Filters and Slicers
Filters let someone narrow the view. A sales report might let a user look at one month, one region, or one product category.
Slicers are the visible controls for that filtering. You will see them more often in Power BI reports than on a standard dashboard tile.
4. Data Sources
A dashboard is only as good as the data behind it. Power BI can connect to Excel workbooks, databases, and supported online services.
The data should be accurate, consistent, and cleaned before you build the visuals.
5. Clear Layout and Design
A good layout puts the most important numbers where people look first. Keep the formatting consistent, the labels readable, and the number of visuals limited.
Skip extra charts and decoration that make the page harder to read.
How to Create a Power BI Dashboard: Step-by-Step Guide
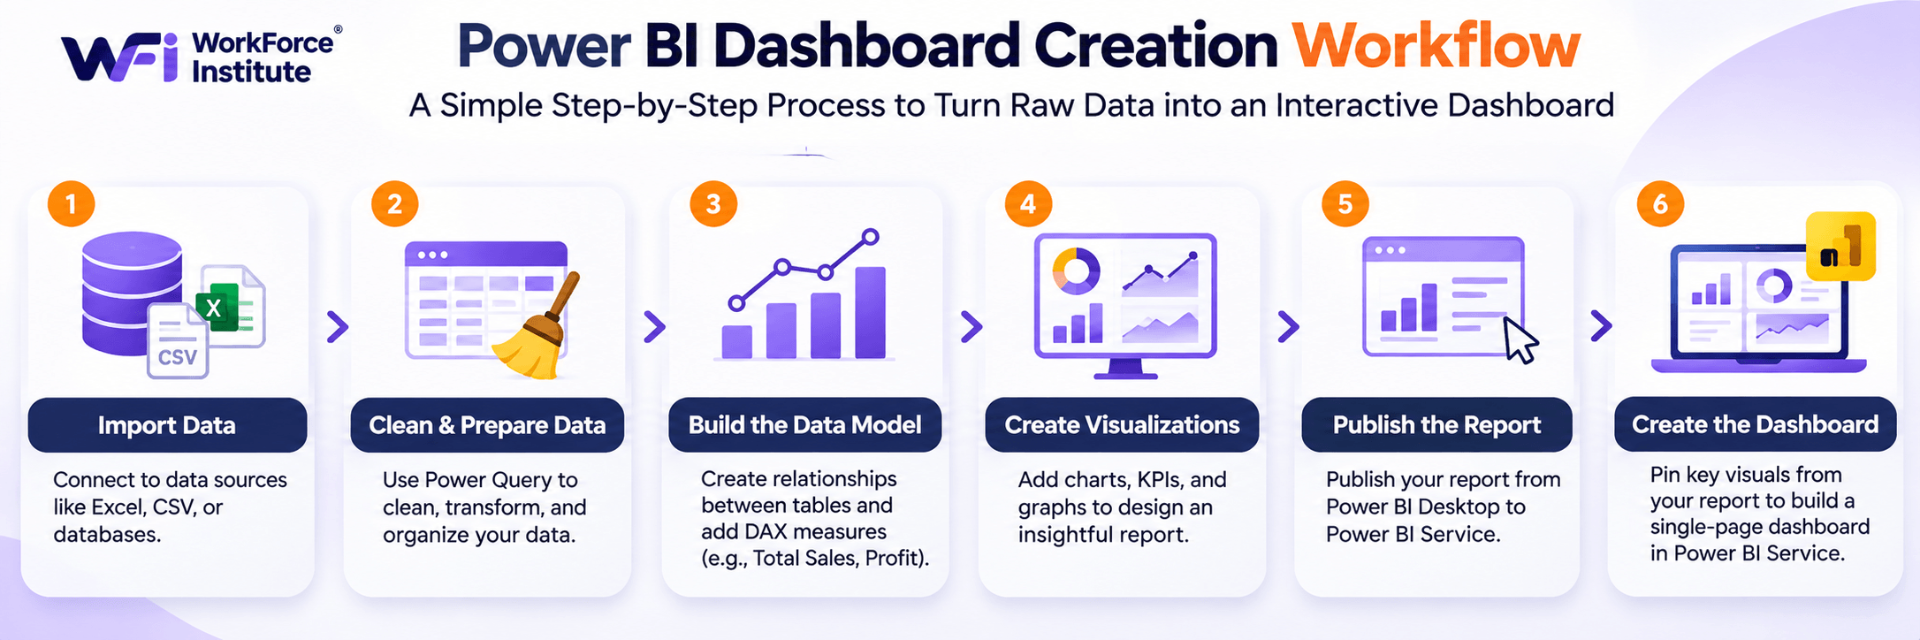
If you are new to Power BI, start small. Use a modest dataset and build a simple sales report before you make your first dashboard. These steps cover the basic workflow.
Step 1: Download and Open Power BI Desktop
Download Microsoft Power BI Desktop from Microsoft's official site. Open it and look around the main screen.
Power BI Desktop is where you connect data, prepare it, build a data model, and create reports.
Step 2: Import Your Dataset
Select Get Data to connect a source. For a first project, an Excel spreadsheet is the easiest option.
You can use a sample sales dataset containing columns such as:
- Order Date
- Product Name
- Category
- Region
- Quantity
- Sales Amount
After you pick the file, preview the rows and load them into Power BI.
Step 3: Clean and Prepare the Data
Before you chart anything, get the data ready. Select Transform Data to open Power Query Editor.
You can use Power Query to:
- Remove duplicate records.
- Remove unnecessary columns.
- Correct data types.
- Handle missing values.
- Rename columns.
- Standardize inconsistent information.
Clean data cuts down on errors and makes the analysis more trustworthy.
Step 4: Create Your First Visualizations
Once the data is ready, start adding visuals on the report canvas.
For example:
- Add a card visual to display total sales.
- Add a bar chart to compare sales by product.
- Add a line chart to show monthly revenue.
- Add a column chart to compare regional sales.
- Add a table to display detailed sales records.
Pick fields from the dataset and drop them onto the right visual.
Step 5: Add Measures and KPIs
Data Analysis Expressions (DAX) is how you create calculations and measures.
For example, a basic measure to calculate total sales is:
Total Sales = SUM(Sales[Sales Amount])Put that measure on a card to show total sales.
With more practice, you can add calculations for profit margin, year-over-year growth, and other business metrics.
Step 6: Organize and Format Your Report
Arrange the visuals so the most important information comes first.
For example, a beginner sales report might have:
- Top section: Total Sales, Total Orders, and Total Quantity.
- Middle section: Monthly sales trends and regional comparisons.
- Bottom section: Product performance and detailed sales records.
Keep colors consistent, titles clear, labels readable, and leave enough space between visuals.
Step 7: Publish Your Report to Power BI Service
When the report is ready, select Publish in Power BI Desktop. Choose the workspace you want in Power BI Service.
From there, you can pin selected visuals from the published report onto a dashboard.
Step 8: Create Your Dashboard
Open the report in Power BI Service. Use the pin option on a visual and choose an existing dashboard, or create a new one.
Do that for each visual you want on the page. Then arrange the tiles into a one-page view of the metrics that matter most.
Your first Power BI dashboard is ready.
Power BI Dashboard Best Practices
Building the dashboard is only half the work. People still have to understand it and use it.
Focus on Your Audience
Know who will open it and what decision they need to make. An executive may want a high-level view. A sales manager may need regional detail.
Highlight Important Metrics
Put the main KPIs where they stand out. Not every chart should compete for attention. A clear hierarchy tells the viewer where to look.
Choose the Right Charts
Bar charts work for comparisons. Line charts work for change over time. Skip 3D charts and visuals that are harder to read than they are worth.
Avoid Information Overload
Too many charts, colors, and numbers make a dashboard hard to use. Keep the metrics that answer the questions that matter.
Keep Data Accurate and Updated
Check data quality and refresh settings on a regular schedule. Wrong or old numbers lead to bad decisions.
Make the Layout Easy to Read
Consistent colors, labels, spacing, and formatting help. A clear dashboard should get its main point across quickly.
Skills You Need to Build Power BI Dashboards
Learning Power BI is more than dropping charts onto a page. To build a dashboard people can use, you need a few related skills.
Data cleaning and preparation: Organize the dataset, fix inconsistencies, and get the information ready to analyze.
Data modeling: Understand how tables relate to each other, and how a model keeps the reporting accurate.
Data visualization: Choose a chart that fits the question, and make the point easy to see.
DAX: Write measures and calculations for the metrics the business actually tracks.
Analytical thinking: Read a pattern, notice a trend, and use the data to answer a business question.
Communication: Explain the finding so both technical and non-technical people can follow it.
Those skills turn raw records into something a business can act on. You can also read our guide on how to become an AI Data Analyst in 2026 for the wider technical and analytical skills this career asks for.
How Learning Power BI Can Support a Data Analytics Career
Power BI is a useful skill if you want to work in data analytics. Companies need people who can prepare information, analyze it, show it, and explain it.
Learning it gives you hands-on practice with business reporting and visualization.
It also sits well next to other analytics skills, including:
- Excel and spreadsheet analysis.
- SQL and database querying.
- Python for data analysis.
- Statistics and analytical methods.
- Data cleaning and preparation.
- Generative AI tools for data-related workflows.
Building dashboards from realistic datasets is also a concrete way to show what you can do in a portfolio.
To see how these tools fit the work data professionals actually do, read our article on what an AI Data Analyst actually does.
Learn Data Analytics and Power BI with WorkForce Institute
If you want to build these skills in a structured program, look at the WorkForce Institute Generative AI Data Analyst program.
The program covers foundational data analytics and statistics, collecting and preparing data, exploring and visualizing it, and Microsoft Power BI. Learners work with Power Query, data modeling, DAX, and interactive dashboards and reports.
It also pairs data analytics with Generative AI concepts and practical projects, so you can see how modern tools support a business decision.
Explore the Generative AI Data Analyst program at WorkForce Institute to see the curriculum and how the program is taught.
Frequently Asked Questions About Power BI Dashboards
1. What is a Power BI dashboard used for?
It is a single page for watching important business metrics, showing the data, tracking performance, and sharing what the numbers mean.
2. Is Power BI suitable for beginners?
Yes. Start in Power BI Desktop, import an Excel file, build a few basic visuals, and then learn data cleaning, modeling, and DAX as you go.
3. What is the difference between a Power BI dashboard and a report?
A dashboard is a single page of visuals, and you create it in Power BI Service. A report can have several pages and interactive visuals, and you can build it in Power BI Desktop.
4. Can I create a Power BI dashboard in Excel?
You can import Excel data into Power BI and use it for reports and dashboards. The dashboard itself is created in Power BI Service, not inside Excel.
5. Do I need coding skills to use Power BI?
You can build basic reports and visuals without traditional programming. DAX and data modeling are what let you go further.
6. What should a beginner Power BI dashboard include?
A few KPI cards, a sales trend, a category comparison, a regional breakdown, and a table of the important details. What you include depends on the dataset and what the dashboard is for.
Final Thoughts
Power BI dashboards make business data easier to read, easier to watch, and easier to explain. For a beginner, a simple dashboard is a practical way to practice visualization and analysis.
Start with a small dataset. Learn how to clean it and organize it. Then build more advanced reports with charts, measures, and data models.
As your Power BI skills grow, build dashboards that answer a real business question. A page of numbers is not the same thing as analysis.
Ready to build these skills? Explore the Generative AI Data Analyst program at WorkForce Institute and see how structured training can prepare you for data-driven roles.