Data is everywhere—from customer purchases and website visits to business transactions and marketing campaigns. However, raw data alone does not provide meaningful insights. To make informed decisions, businesses need to organize, analyze, and interpret their data.
This is where SQL comes in. SQL, or Structured Query Language, is one of the most important tools for working with data. It allows analysts to retrieve information from databases, filter records, calculate metrics, and identify patterns that support business decisions.
Whether you are starting your journey in data analytics or looking to strengthen your technical skills, learning SQL for data analysis can help you work more efficiently with data and prepare for a range of analytics-related roles.
SQL is a foundational skill for many data-focused roles. To understand how data analyst responsibilities compare with those of data scientists, read WFI’s Data Analyst vs. Data Scientist: Roles, Skills, and Career Differences.
What Is SQL?
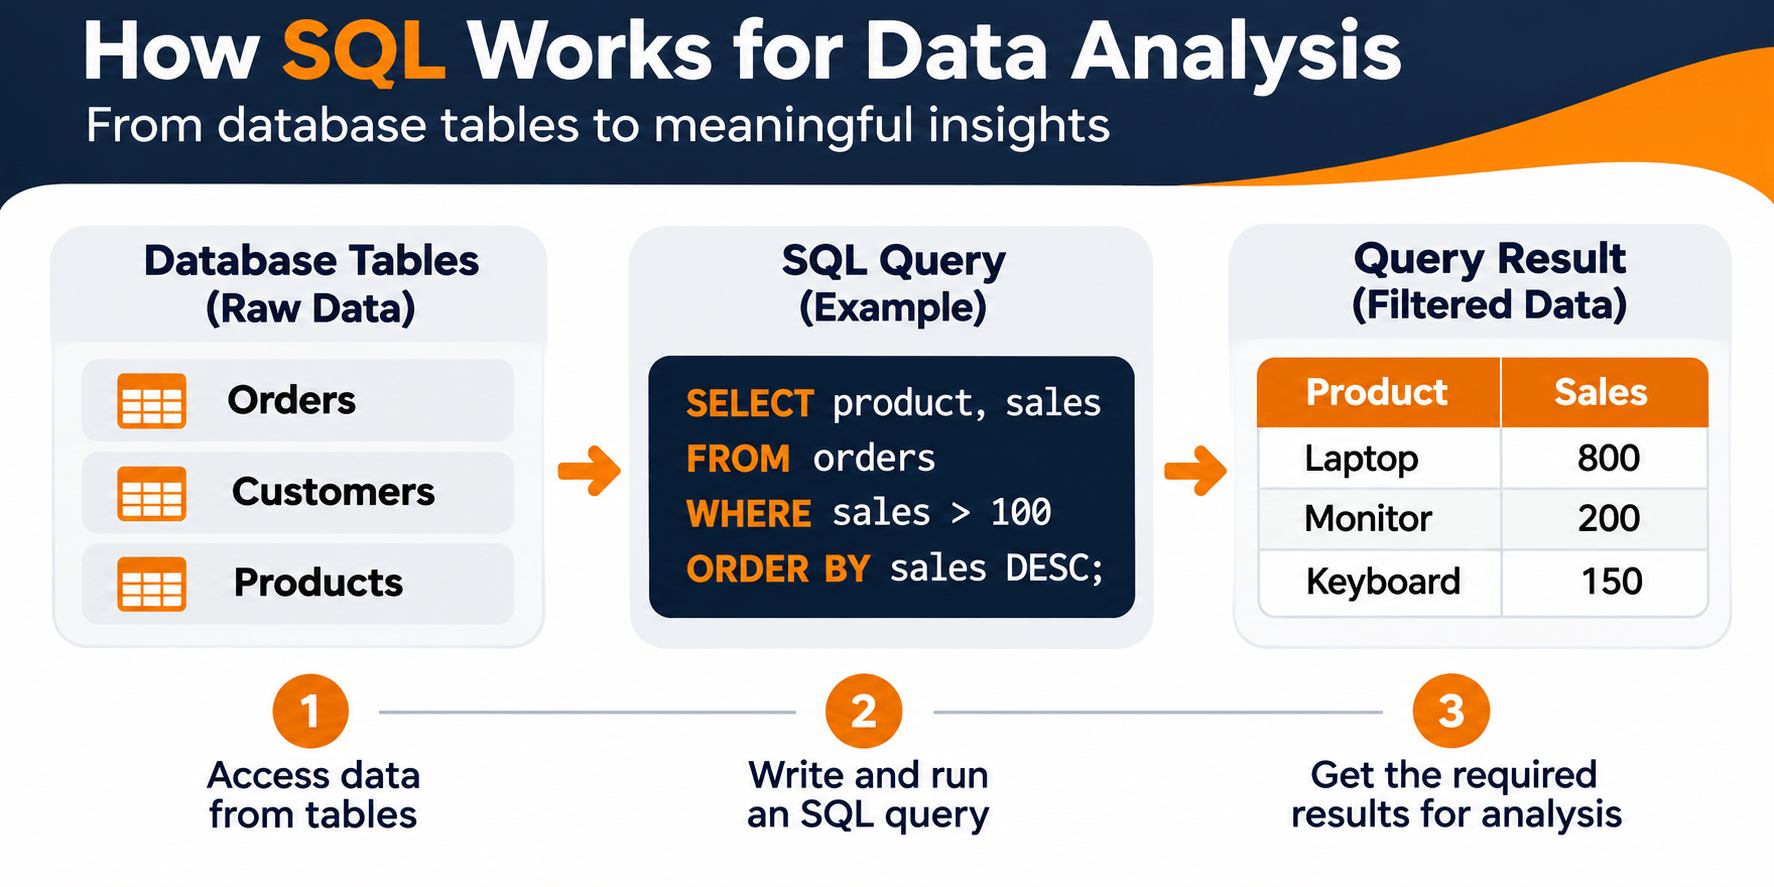
SQL stands for Structured Query Language. It is a programming language used to communicate with relational databases. SQL helps users retrieve, insert, update, and manage data stored in tables.
A relational database organizes information into tables made up of rows and columns. Each table typically represents a specific type of information, such as customers, orders, products, or employees.
For example, an online store might maintain a customer table containing customer names and email addresses, an orders table containing purchase information, and a products table containing product details.
SQL allows analysts to retrieve information from these tables and answer questions such as:
- How many customers placed an order this month?
- Which products generated the highest revenue?
- What is the average order value?
- Which regions have the highest sales?
- How has revenue changed over time?
Instead of manually reviewing thousands of records, analysts can use SQL queries to retrieve the information they need.
Why Is SQL Important for Data Analysis?
SQL is widely used in data analysis because it makes working with large amounts of structured data more manageable. It helps analysts access information directly from databases and perform calculations without manually processing every record.
Some of the key benefits of using SQL for data analysis include:
- Efficient data retrieval: SQL can retrieve specific records from large databases based on defined conditions.
- Data filtering: Analysts can focus on relevant information by applying filters.
- Data aggregation: SQL can calculate totals, averages, counts, and other useful metrics.
- Data combination: SQL joins allow analysts to combine information from multiple tables.
- Repeatable analysis: Queries can be saved and reused for recurring reports.
- Business insights: SQL helps transform raw data into information that supports business decisions.
SQL is also commonly used alongside tools such as Excel, Python, and business intelligence platforms. For example, an analyst may use SQL to retrieve sales data, Excel to perform additional calculations, and a visualization tool to present the results. As AI tools become more common in analytics workflows, WFI explores this shift in The Strategic Evolution of the Data Analyst: Why Generative AI Is the New Prerequisite.
As analytics work evolves, professionals are also learning how AI can support data preparation and insight generation. Read WFI’s article on the changing role of the data analyst with Generative AI.
Understanding the Basics of a SQL Database
Before writing SQL queries, it is useful to understand how data is organized in a relational database.
Tables
A table stores related information in rows and columns. For example, a sales table might contain details about customer purchases.
| Order_ID | Customer | Product | Quantity | Price |
|---|---|---|---|---|
| 101 | Ali | Laptop | 1 | 800 |
| 102 | Sara | Mouse | 2 | 25 |
| 103 | Ahmed | Keyboard | 1 | 50 |
| 104 | Fatima | Monitor | 1 | 200 |
Rows
Each row represents an individual record. In the sales table above, each row represents one order.
Columns
Each column represents a specific attribute, such as the order ID, customer name, product, quantity, or price.
Primary Keys
A primary key is a column, or combination of columns, that uniquely identifies each record in a table. For example, Order_ID can be used as the primary key in the sales table.
Foreign Keys
A foreign key is a column that references a key in another table. Foreign keys help establish relationships between tables. For example, a Customer_ID in an orders table may reference the Customer_ID in a customers table.
Basic SQL Commands for Data Analysis
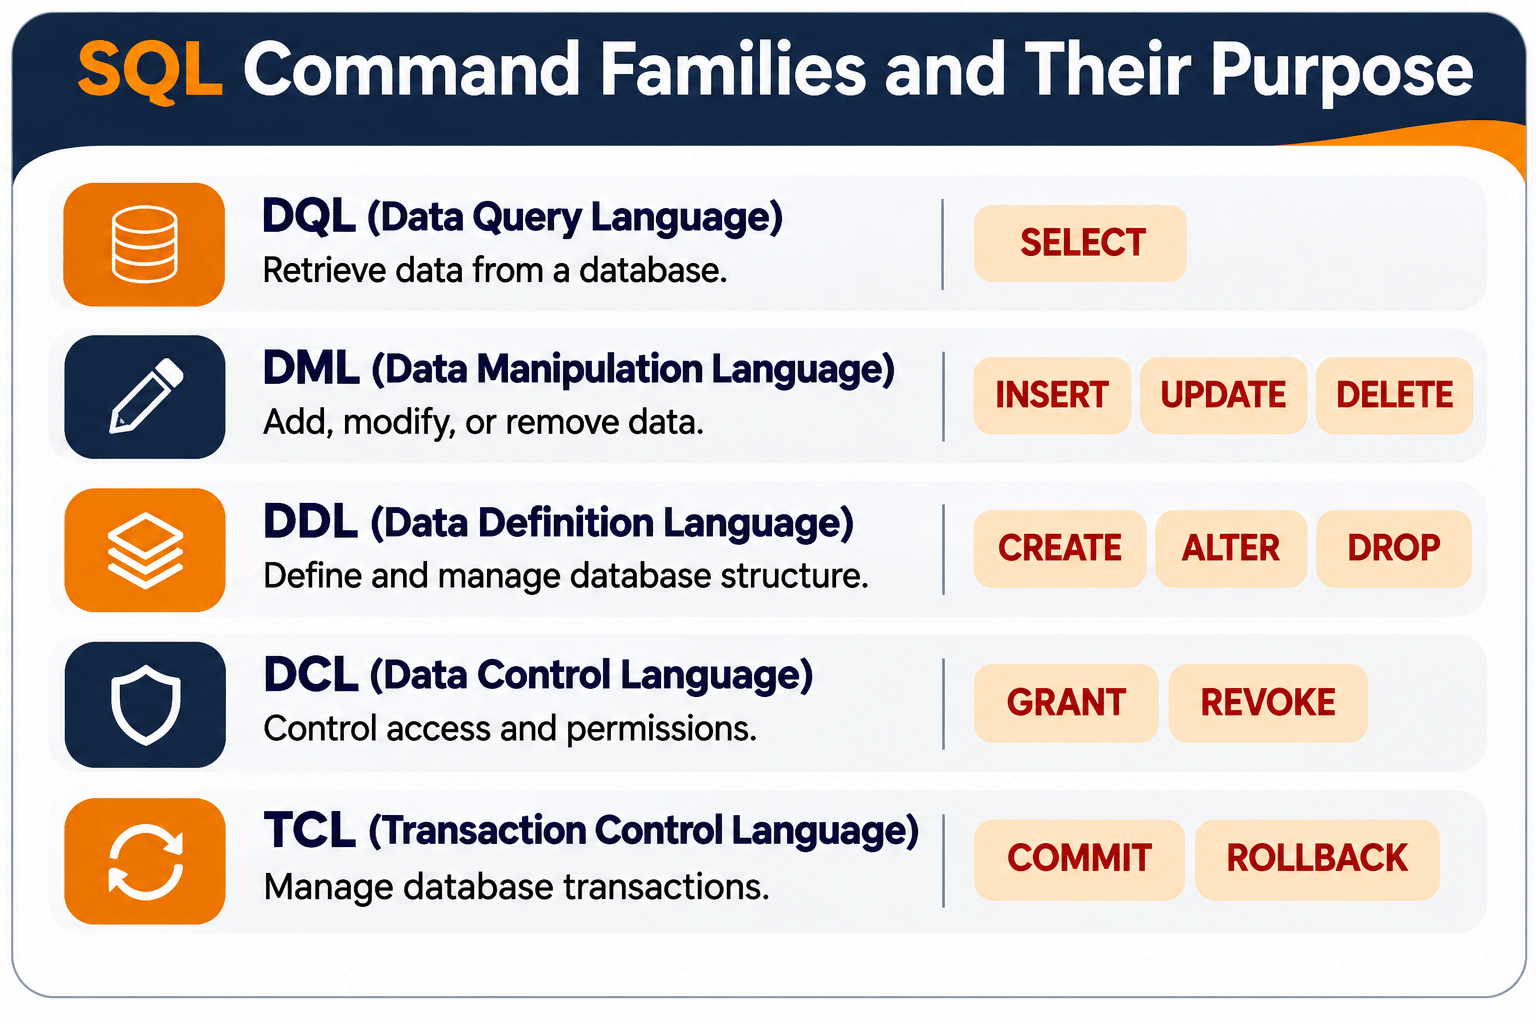
SQL includes several commands that analysts use regularly. The following commands are particularly important for beginners.
1. SELECT: Retrieve Data
The SELECT statement retrieves data from a database table.
SELECT Customer, Product, Price
FROM Sales;
This query returns the Customer, Product, and Price columns from the Sales table.
To retrieve every column, use an asterisk:
SELECT *
FROM Sales;
Although SELECT * is useful when exploring a table, selecting only the required columns is often better for analysis because it makes queries easier to understand and can reduce unnecessary data retrieval.
2. WHERE: Filter Records
The WHERE clause filters records based on a condition.
SELECT *
FROM Sales
WHERE Price > 100;
This query returns only the records where the price is greater than 100.
You can also use comparison operators such as:
=— Equal to>— Greater than<— Less than>=— Greater than or equal to<=— Less than or equal to<>— Not equal to
3. ORDER BY: Sort Data
The ORDER BY clause sorts records in ascending or descending order.
SELECT *
FROM Sales
ORDER BY Price DESC;
This query displays sales records from the highest price to the lowest price.
Use ASC for ascending order and DESC for descending order.
4. LIMIT: Restrict the Number of Results
The LIMIT clause restricts the number of rows returned by a query in databases such as MySQL and PostgreSQL.
SELECT *
FROM Sales
ORDER BY Price DESC
LIMIT 3;
This query returns the three records with the highest prices.
Note: SQL syntax varies between database systems. For example, SQL Server commonly uses TOP or OFFSET/FETCH instead of LIMIT.
Practical SQL Examples for Data Analysis
Understanding SQL commands is useful, but applying them to real-world questions is what makes SQL valuable for data analysis.
Consider a business that wants to understand its sales performance. The following examples demonstrate how SQL can be used to analyze sales data.
Example 1: Calculate Total Revenue
A business may want to know how much revenue it has generated from its sales.
Assume the Sales table contains Quantity and Price columns. The revenue for each order can be calculated by multiplying the quantity by the price.
SELECT
    SUM(Quantity * Price) AS Total_Revenue
FROM Sales;
The SUM() function adds the revenue from all records. The result provides the total revenue represented by the data in the table.
Example 2: Find the Average Order Value
Average order value (AOV) helps businesses understand how much customers spend per order.
SELECT
    AVG(Quantity * Price) AS Average_Order_Value
FROM Sales;
This query calculates the average value of the order records in the Sales table.
If the table contains multiple product rows for a single order, the calculation should first aggregate the order totals by Order_ID. This ensures that the average is calculated at the order level rather than the product-row level.
Example 3: Identify the Best-Selling Products
A business may want to identify which products sell the most units.
SELECT
    Product,
    SUM(Quantity) AS Total_Units_Sold
FROM Sales
GROUP BY Product
ORDER BY Total_Units_Sold DESC;
This query groups sales records by product, calculates the total units sold, and sorts the results from highest to lowest.
The output can help a business identify popular products and understand customer purchasing patterns.
Example 4: Analyze Sales by Customer
Customer-level analysis can help businesses understand purchasing behavior and identify their most valuable customers.
SELECT
    Customer,
    SUM(Quantity * Price) AS Customer_Revenue
FROM Sales
GROUP BY Customer
ORDER BY Customer_Revenue DESC;
This query calculates the revenue associated with each customer and sorts customers by their total revenue.
In a real database, customer analysis is often performed using a Customer_ID rather than a customer name, because names may not be unique.
Example 5: Filter Sales Within a Price Range
The BETWEEN operator can be used to retrieve records within a specified range.
SELECT *
FROM Sales
WHERE Price BETWEEN 50 AND 200;
This query returns records where the price is between 50 and 200, including both boundary values.
Range filters can be useful when analyzing product categories, transaction values, or specific periods of time.
Using GROUP BY and Aggregate Functions
Aggregate functions perform calculations on multiple records and return a single result. They are frequently used in SQL for data analysis.
Common aggregate functions include:
| Function | Purpose | Example |
|---|---|---|
| COUNT() | Counts records or non-null values | COUNT(*) |
| SUM() | Adds numeric values | SUM(Price) |
| AVG() | Calculates the average | AVG(Price) |
| MIN() | Returns the smallest value | MIN(Price) |
| MAX() | Returns the largest value | MAX(Price) |
The GROUP BY clause organizes records into groups so aggregate functions can calculate results for each group.
For example, to calculate the total revenue for each product:
SELECT
    Product,
    SUM(Quantity * Price) AS Total_Revenue
FROM Sales
GROUP BY Product;
To calculate the number of orders associated with each customer:
SELECT
    Customer,
    COUNT(*) AS Number_Of_Orders
FROM Sales
GROUP BY Customer;
Important: COUNT(*) counts rows. If your table contains multiple rows for the same order, it will not necessarily represent the number of unique orders. Use COUNT(DISTINCT Order_ID) when you need to count unique order IDs.
Filtering Groups with HAVING
WHERE filters individual records before grouping, while HAVING filters groups after aggregate calculations have been performed.
For example, a business may want to identify customers who generated more than 500 in revenue.
SELECT
    Customer,
    SUM(Quantity * Price) AS Total_Revenue
FROM Sales
GROUP BY Customer
HAVING SUM(Quantity * Price) > 500;
This query groups sales by customer and returns only customers whose total revenue exceeds 500.
Understanding the difference between WHERE and HAVING is important when writing SQL queries for analytical tasks.
Combining Data with SQL JOINs
Business data is often stored in multiple related tables. SQL JOINs allow analysts to combine information from those tables.
Consider two tables: Customers and Orders.
Customers Table
| Customer_ID | Customer_Name | City |
|---|---|---|
| 1 | Ali | Lahore |
| 2 | Sara | Karachi |
| 3 | Ahmed | Islamabad |
Orders Table
| Order_ID | Customer_ID | Order_Amount |
|---|---|---|
| 101 | 1 | 800 |
| 102 | 2 | 250 |
| 103 | 1 | 150 |
To retrieve customer names alongside their order amounts, use an INNER JOIN:
SELECT
    Customers.Customer_Name,
    Orders.Order_Amount
FROM Customers
INNER JOIN Orders
    ON Customers.Customer_ID = Orders.Customer_ID;
This query matches records from the Customers and Orders tables using Customer_ID.
Common Types of SQL JOINs
| JOIN Type | What It Returns |
|---|---|
| INNER JOIN | Records with matching values in both tables |
| LEFT JOIN | All records from the left table and matching records from the right table |
| RIGHT JOIN | All records from the right table and matching records from the left table |
| FULL OUTER JOIN | All records from both tables, including unmatched records |
JOINs are especially useful when analyzing customer behavior, sales performance, product trends, and other business metrics that require information from multiple tables.
SQL for Data Analysis: A Real-World Example
Imagine an online retail business wants to identify its highest-revenue products. The business stores order details in a table named Sales.
The table includes the following columns:
- Order_ID
- Product
- Quantity
- Price
- Order_Date
The business wants to answer three questions:
- Which products generated the highest revenue?
- How many units of each product were sold?
- Which products should the business investigate for future sales opportunities?
The following query can help answer the first two questions:
SELECT
    Product,
    SUM(Quantity) AS Total_Units_Sold,
    SUM(Quantity * Price) AS Total_Revenue
FROM Sales
GROUP BY Product
ORDER BY Total_Revenue DESC;
The query groups records by product and calculates total units sold and total revenue. The results are sorted by revenue in descending order.
The analyst can then use the results to identify high-revenue products and investigate whether sales performance is influenced by pricing, customer demand, marketing campaigns, or other factors.
SQL provides the calculations, but interpreting the results requires analytical thinking and an understanding of the business context.
Common SQL Mistakes Beginners Should Avoid
When learning SQL, beginners may encounter errors or produce results that do not accurately answer their questions. Understanding common mistakes can help improve query quality.
1. Forgetting the WHERE Condition
Without a WHERE condition, a query may return every record in a table when only a subset is required.
SELECT *
FROM Sales
WHERE Order_Date >= '2026-01-01';
Always check whether your query needs a filter before retrieving data.
2. Using WHERE Instead of HAVING
WHERE is used to filter individual records, while HAVING is used to filter grouped results.
SELECT
    Product,
    SUM(Quantity) AS Total_Units_Sold
FROM Sales
GROUP BY Product
HAVING SUM(Quantity) > 10;
This query filters products based on their total units sold.
3. Incorrectly Joining Tables
Joining tables using the wrong columns can produce duplicate records or inaccurate calculations.
Before writing a JOIN, identify the relationship between the tables and confirm which columns should be used to match records.
4. Ignoring NULL Values
NULL represents a missing or unknown value. Aggregate functions such as SUM() and AVG() generally ignore NULL values, while COUNT(*) counts rows regardless of whether individual columns contain NULL.
Consider how missing values affect your analysis before interpreting the results.
5. Misinterpreting the Results
A query may execute successfully but still produce results that do not answer the business question. For example, calculating average product-row revenue is not necessarily the same as calculating average order value.
Always confirm the level of detail in your data and ensure that your calculations match the metric you want to measure.
How to Learn SQL for Data Analysis
Learning SQL becomes easier when you combine theoretical knowledge with practical exercises. Beginners can follow a structured approach to develop their skills.
1. Understand Database Fundamentals
Start by learning how relational databases work. Understand tables, rows, columns, primary keys, foreign keys, and relationships between tables.
2. Practice Basic SQL Queries
Learn SELECT, WHERE, ORDER BY, and LIMIT. These commands provide the foundation for retrieving and exploring data.
3. Learn Aggregate Functions
Practice using COUNT(), SUM(), AVG(), MIN(), and MAX() with GROUP BY and HAVING. These functions are essential for calculating business metrics.
4. Work with Multiple Tables
Learn how to use JOINs to combine related data. Practice with customer, sales, product, and transaction tables.
5. Solve Practical Data Problems
Apply SQL to realistic questions such as identifying top-selling products, calculating revenue, comparing customer activity, and analyzing trends over time.
6. Build Data Analysis Projects
Projects provide an opportunity to apply SQL skills to a complete analytical task. For example, you could analyze a retail dataset, identify sales trends, and summarize your findings in a report or dashboard.
For a broader look at the skills and career options in this field, see WFI’s guide to becoming an AI analyst.
SQL and Data Analyst Career Opportunities
SQL is a valuable skill for professionals working with data. Many roles involve retrieving information from databases, analyzing business metrics, and communicating findings to stakeholders.
SQL may be used in roles such as:
- Data Analyst: Retrieves, cleans, and analyzes data to support business decisions.
- Business Analyst: Uses data to understand business processes, performance, and opportunities for improvement.
- Business Intelligence Analyst: Analyzes business data and develops reports or dashboards.
- Marketing Analyst: Evaluates campaign performance, customer behavior, and marketing metrics.
- Operations Analyst: Uses data to examine operational performance and identify opportunities to improve efficiency.
SQL alone does not guarantee a particular role. Data professionals often combine SQL with analytical thinking, data visualization, communication, and knowledge of the business domain.
If you are exploring a data-focused career, WFI’s article How to Become an AI Analyst: Skills, Career Path, and Opportunities discusses skills and career considerations for this evolving field.
Frequently Asked Questions About SQL for Data Analysis
What is SQL used for in data analysis?
SQL is used to retrieve, filter, organize, combine, and analyze data stored in relational databases. Analysts use it to calculate metrics, identify trends, and answer business questions.
Is SQL difficult to learn for beginners?
SQL is often considered approachable for beginners because its basic commands use a readable, structured syntax. Learning more advanced concepts, such as complex joins, subqueries, and window functions, requires continued practice.
Do data analysts need to know SQL?
SQL is an important skill for many data analyst roles because it allows professionals to access and analyze data stored in databases. The level of SQL knowledge required depends on the role, organization, and data environment.
Can I use SQL without knowing Python?
Yes. SQL can be used independently to query and analyze relational databases. Python can be useful for additional tasks such as statistical analysis, automation, and data processing, but it is not required for writing SQL queries.
What are the most important SQL commands for data analysis?
Beginners should focus on SELECT, WHERE, ORDER BY, GROUP BY, HAVING, JOIN, and aggregate functions such as COUNT(), SUM(), and AVG(). These commands are commonly used to retrieve and summarize data.
How long does it take to learn SQL for data analysis?
The time required depends on your experience, practice routine, and learning goals. Beginners can start writing basic queries relatively quickly, but developing confidence with complex analytical queries requires consistent practice.
Conclusion
SQL is one of the foundational skills for data analysis. It allows analysts to retrieve information from databases, filter records, calculate metrics, combine datasets, and uncover insights that support business decisions.
By learning basic SQL commands and practicing with real-world datasets, beginners can build a strong foundation for more advanced analytical work. Concepts such as aggregate functions, GROUP BY, HAVING, and JOINs are especially useful for answering practical business questions.
As you continue learning, focus on solving real problems rather than memorizing commands. The ability to write accurate queries and interpret their results is what makes SQL valuable in data analysis.
To continue exploring how analytics careers are evolving, read WFI’s article about the changing role of data analysts and Generative AI.