Every business creates information as it works. Sales, customer conversations, financial records, employee performance, inventory, and marketing campaigns all produce data. Having that information is not the same as knowing what is happening or what to do next.
Companies need a steady way to turn information into knowledge they can use for planning, performance, and strategy. That is the job of business intelligence (BI).
Business intelligence brings together processes, technology, and the way an organization works. It helps a company see how it operates, judge performance, spot opportunities, and respond to problems. Decision-makers can plan from reliable information instead of assumptions.
BI can explain why customer retention is falling, which markets are profitable, and where operations can run more efficiently. It connects everyday work with the wider business goals.
This guide covers what business intelligence means, how its lifecycle works, the main types of BI, core concepts, practical uses, how to put it in place, and the role of artificial intelligence.
What Is Business Intelligence?
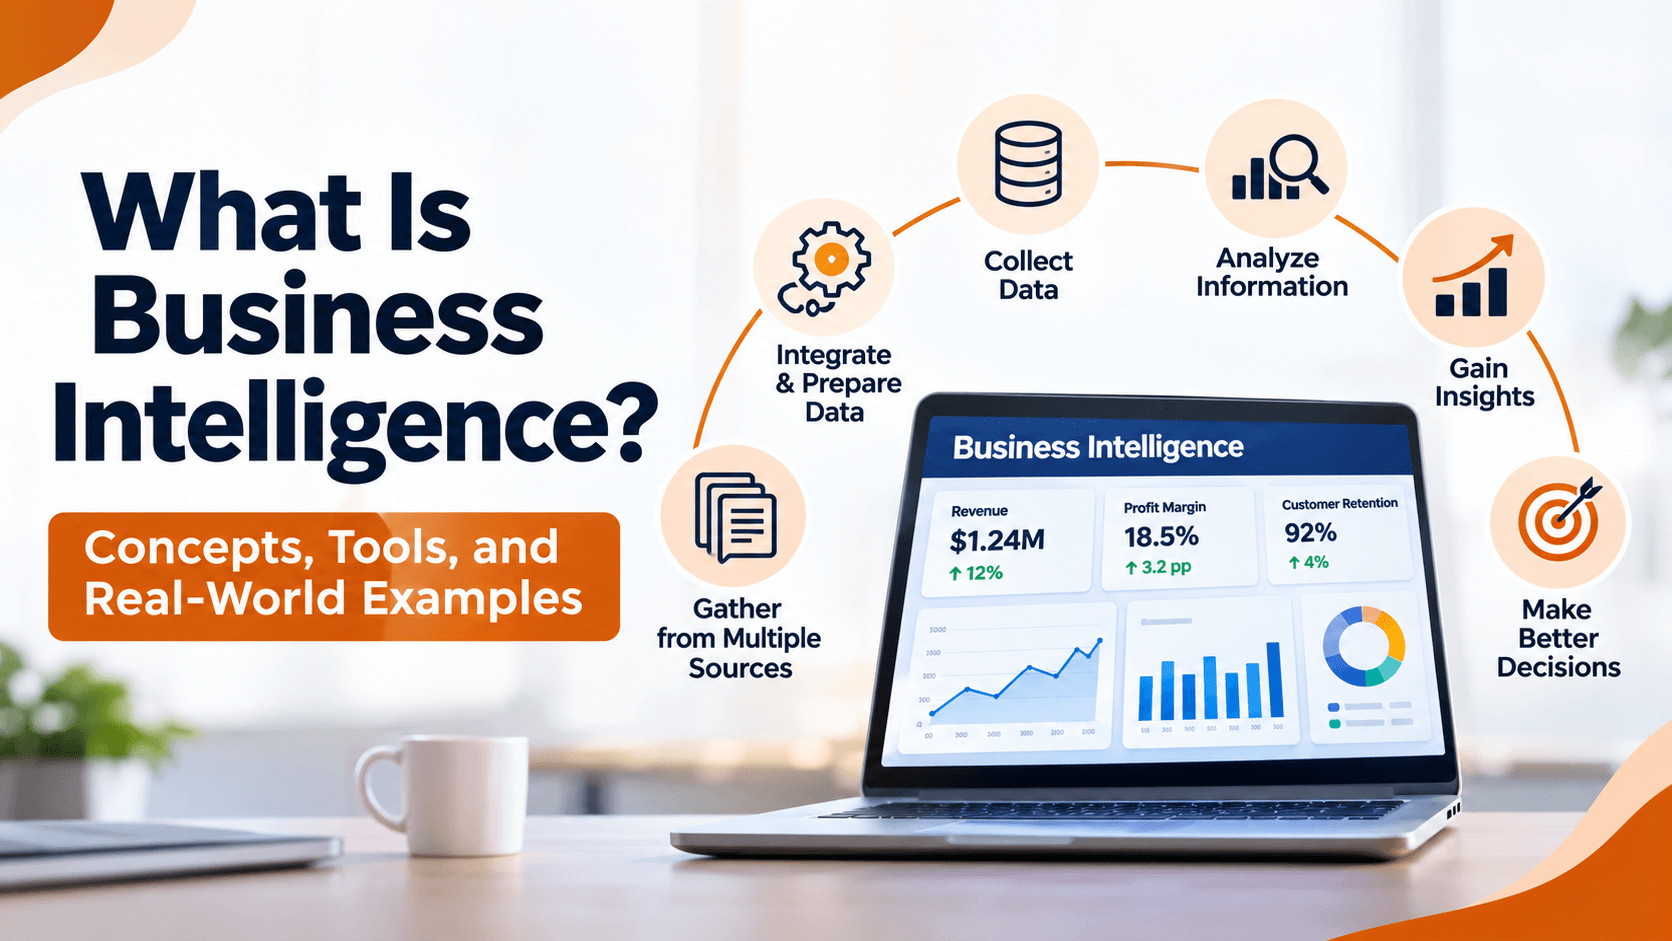
Business intelligence is the work of collecting, organizing, analyzing, and interpreting business information so an organization can make better decisions.
It is more than a report or a dashboard. BI shows how activities, performance, resources, customers, and business goals relate to each other.
A company might see revenue rise while profit falls. Revenue alone does not explain that. A BI approach also looks at operating expenses, product costs, customer acquisition costs, and regional performance to find what changed.
Business intelligence helps answer questions such as:
- How is the organization performing against its business goals?
- Which products, services, or business areas generate the most value?
- Why are operating costs increasing?
- Which customer groups are most valuable to the organization?
- Where are delays, inefficiencies, or performance problems occurring?
- Which areas require management attention or additional investment?
The aim is to give decision-makers information that is useful, relevant, and on time, so they can see the business clearly and choose what to do.
Example: A retail company experiences a decline in profit despite increasing sales. Business intelligence analysis reveals that shipping costs and product returns have increased significantly. Management can use this information to investigate delivery problems, review product quality, and improve its operating strategy.
Business Intelligence vs. Traditional Reporting
Traditional reporting and business intelligence both help an organization see its work. They do different jobs.
Traditional reporting usually shows what already happened. Business intelligence goes further. It connects information from different parts of the business, looks at performance, finds patterns, and helps people decide what to look at next.
| Aspect | Traditional Reporting | Business Intelligence |
|---|---|---|
| Main purpose | Present business information and results. | Support business understanding and decision-making. |
| Information | Often focuses on predefined reports. | Connects information from multiple business areas. |
| Analysis | Usually summarizes recorded performance. | Supports comparisons, investigation, and deeper analysis. |
| Questions answered | What happened? | What happened, where, why, and what should be investigated? |
| Business value | Provides visibility into activities. | Connects insights with business goals and potential actions. |
Traditional reports still belong in a BI environment. Business intelligence builds on them by tying the numbers to business questions, performance measures, and decisions.
How Business Intelligence Creates Business Value
BI creates value when people use information to run the business and decide better. The work connects data to a goal. Collecting information with no purpose does not.
1. Understanding Business Performance
Leaders need to know whether the work is producing the results they expected. BI helps them look at revenue, profit, productivity, customer retention, costs, and other measures that matter.
2. Identifying Problems Earlier
Regular analysis can show a change that needs attention. A jump in customer complaints, a drop in sales in one region, or rising operating expenses can point to a problem underneath.
3. Recognizing Business Opportunities
The same information can show an opening: growing demand for a product, a customer group that is underserved, or a region that could support expansion.
4. Improving Resource Allocation
Budgets, people, equipment, and time are limited. BI helps decision-makers see where those resources are working and where they should change.
5. Connecting Decisions With Business Goals
When measures are tied to organizational goals, teams can see how their work contributes to the wider result. That makes it easier for management and operations to stay aligned.
Key takeaway: Business intelligence is valuable when it helps an organization understand a business problem, evaluate its possible causes, and take action based on reliable information.
The Business Intelligence Lifecycle
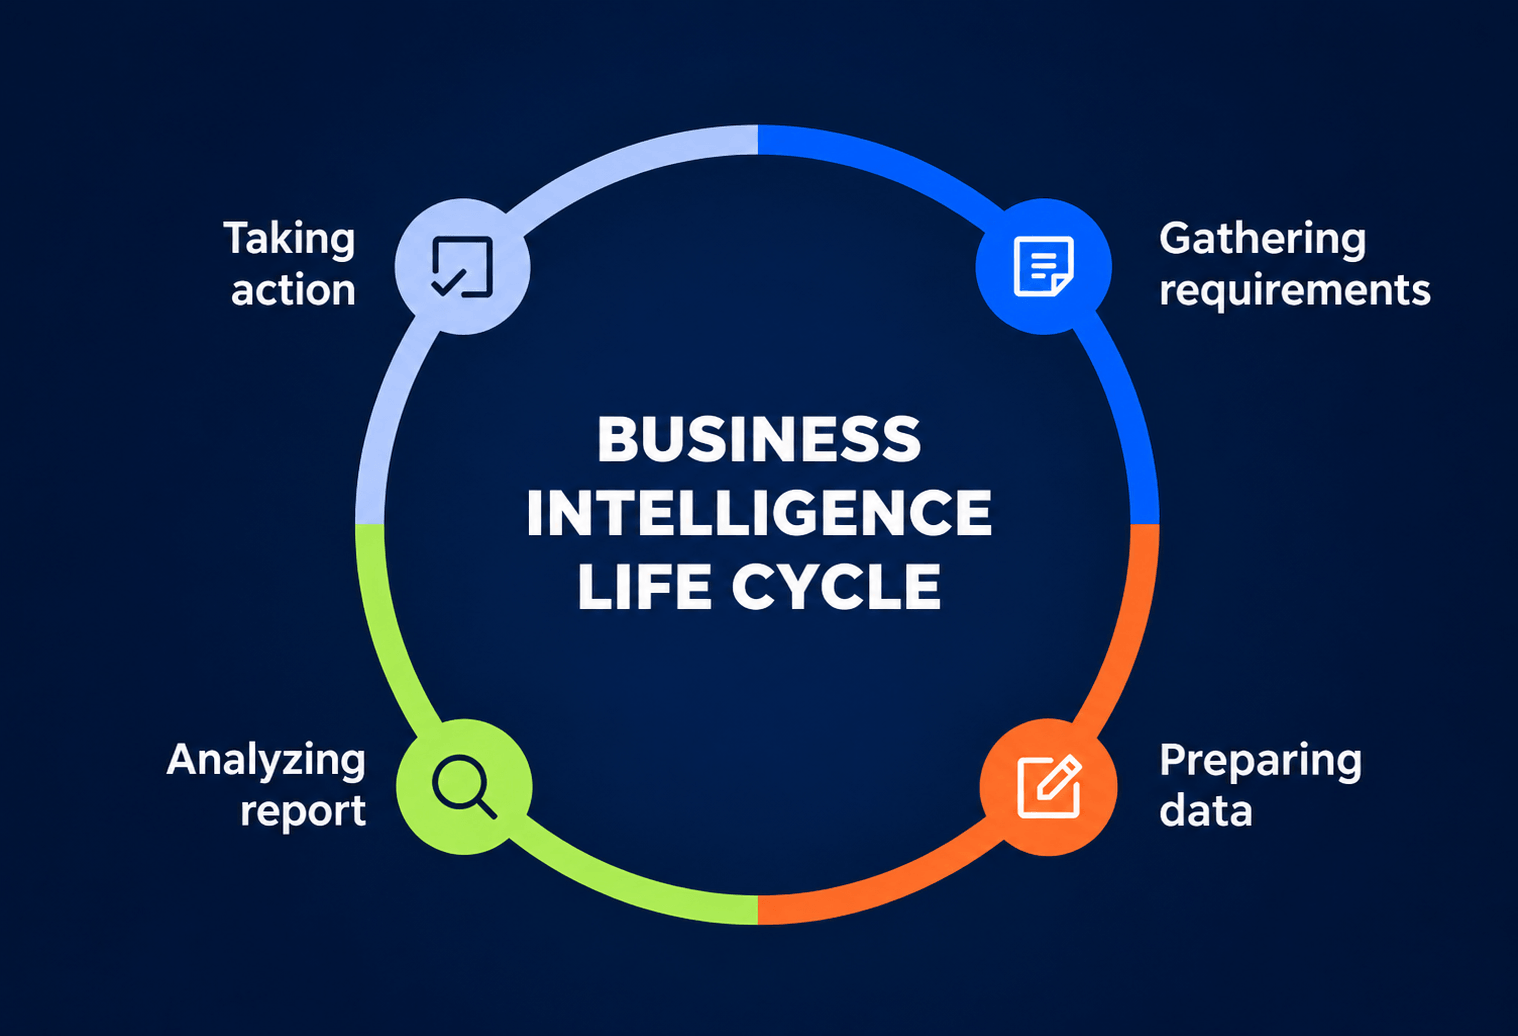
The business intelligence lifecycle is how an organization moves from collecting information to using what it learns and checking the result of its decisions. It is an ongoing cycle, not a one-time report.
1. Define Business Questions
Every BI effort should start with a clear business question. The organization needs to say what it wants to understand or improve.
Examples include:
- Why are customer cancellations increasing?
- Which product categories are becoming less profitable?
- How can the organization reduce delivery delays?
- Which marketing activities generate the most valuable leads?
Starting with the question helps the team collect the information it needs and skip data that will not be used.
2. Collect Relevant Information
Once the objective is clear, the organization finds the systems that hold the relevant information. Those may include financial software, CRM platforms, ERP systems, sales databases, customer feedback, and operational records.
Collect information that is relevant, reliable, and suited to the question.
3. Integrate and Prepare Data
Information from different systems often uses different formats, definitions, and structures. It has to be prepared before the analysis means anything.
This may involve:
- Removing duplicate records.
- Correcting inconsistent values.
- Handling missing information.
- Combining data from different systems.
- Standardizing dates, categories, and measurement units.
- Validating records for accuracy.
Organizations may use ETL processes to extract information, transform it into a consistent structure, and load it into a destination for reporting and analysis.
Understanding SQL for data analysis can help professionals retrieve, filter, combine, and prepare structured information from databases.
4. Analyze Business Information
After the information is prepared, analysts look for patterns, differences, trends, and possible causes of a change in performance.
A company looking into falling customer retention might compare customer groups, purchase frequency, service complaints, and cancellation dates to see where the problem sits.
5. Interpret the Findings
The results still need a business reading. A change in a metric does not, by itself, explain why it happened or what the organization should do.
Analysts and stakeholders should weigh business conditions, data limits, past performance, and other relevant factors before they conclude anything.
6. Take Business Action
An insight is useful when it supports a decision. Depending on the findings, an organization may change pricing, fix a process, move resources, update a marketing plan, or look harder at one part of the business.
7. Measure the Results
After the action, the organization should watch the results and compare them with the original objective. That shows whether the decision produced the improvement it was meant to.
Those findings feed the next round of business intelligence, so evaluation and improvement continue.
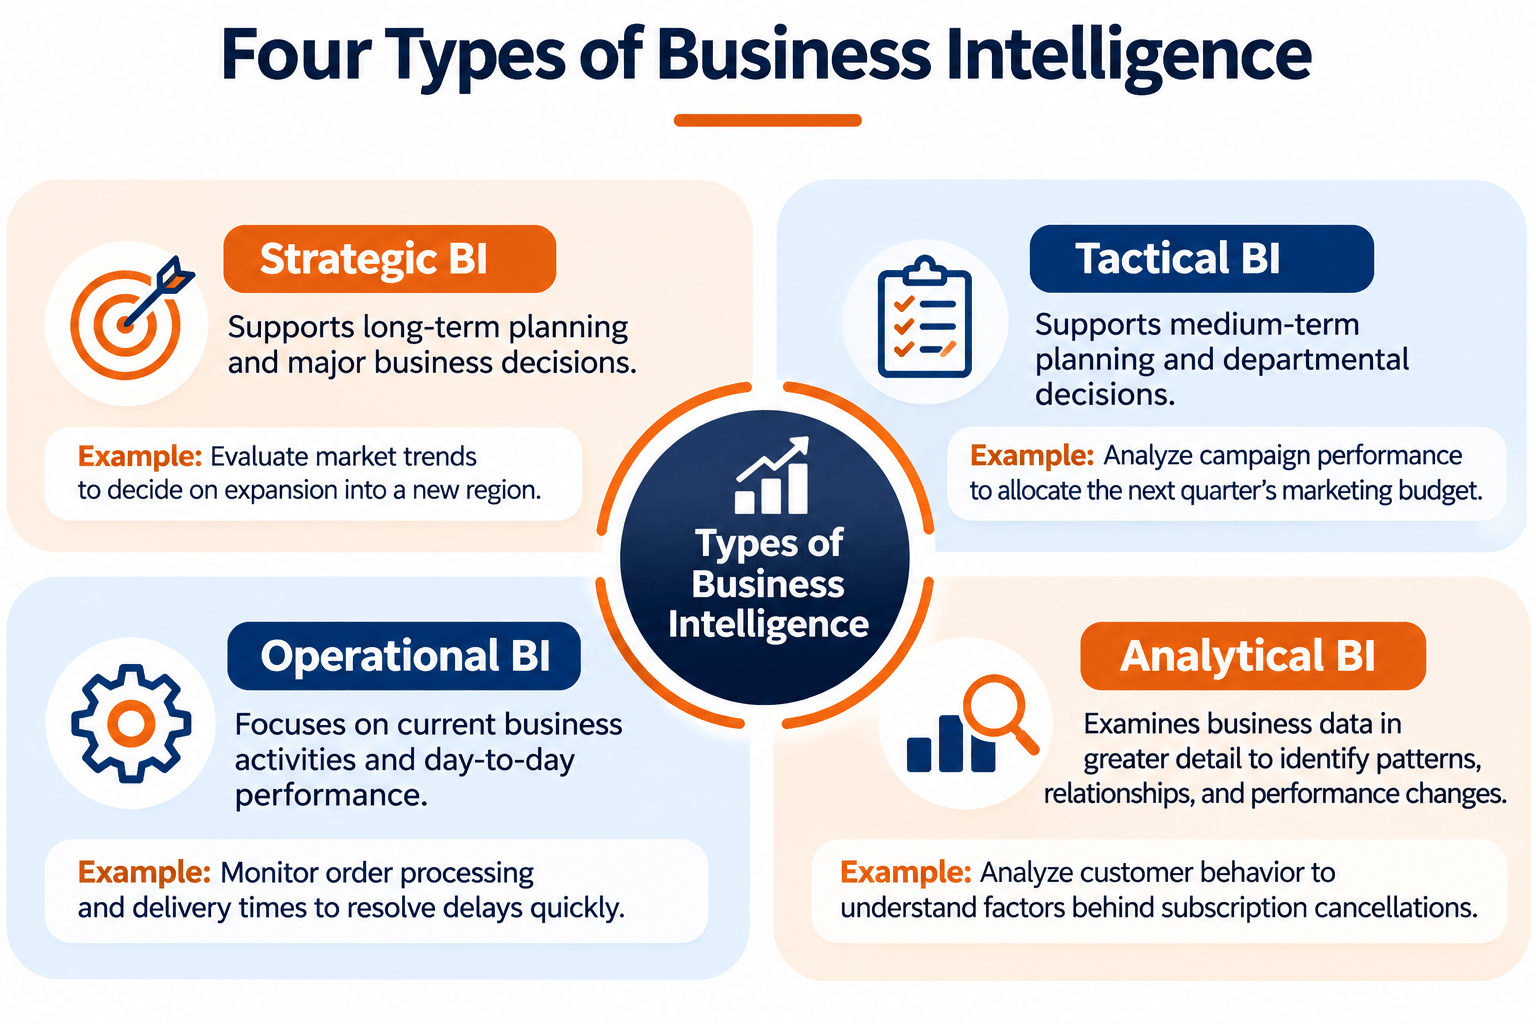
Four Key Types of Business Intelligence
Business intelligence can be grouped by the kind of decision it supports. Four useful categories are strategic, tactical, operational, and analytical BI.
1. Strategic Business Intelligence
Strategic BI supports long-term planning and major decisions. It gives senior management a view of business performance, market conditions, organizational goals, and longer-term opportunities.
Example: A company examines several years of revenue, profitability, customer demand, and market information before deciding whether to expand into a new region.
Typical users: Executives, business owners, senior leaders, and strategy teams.
2. Tactical Business Intelligence
Tactical BI supports medium-term planning and decisions inside a department. It helps managers adjust resources, budgets, and team work so they can meet organizational objectives.
Example: A marketing manager reviews campaign performance and lead conversion results to decide how the next quarter's advertising budget should be distributed.
Typical users: Department managers, business analysts, marketing managers, and finance teams.
3. Operational Business Intelligence
Operational BI focuses on what is happening now. It helps teams watch processes, catch immediate issues, and respond when operations change.
Example: A logistics team monitors delivery status, delayed shipments, order processing times, and warehouse activity to identify problems that need immediate attention.
Typical users: Operations managers, supervisors, customer service teams, and frontline employees.
4. Analytical Business Intelligence
Analytical BI looks at business information in more detail to understand patterns, relationships, and changes in performance. It may include statistical analysis, historical comparisons, segmentation, and more advanced methods.
Example: A subscription company analyzes customer activity, renewal history, and service interactions to understand which customer groups are more likely to cancel their subscriptions.
Typical users: BI analysts, data analysts, business analysts, and analytics teams.
| BI Type | Main Focus | Example Business Question |
|---|---|---|
| Strategic | Long-term organizational direction. | Should we expand into a new market? |
| Tactical | Departmental planning and resource allocation. | How should next quarter's budget be distributed? |
| Operational | Current activities and process performance. | Which orders are delayed today? |
| Analytical | Detailed examination of business information. | What factors are associated with customer cancellations? |
These categories work together. A business may use operational BI to spot a current problem, analytical BI to investigate it, tactical BI to plan a response, and strategic BI to judge the longer-term effect.
Key Business Intelligence Concepts Every Organization Should Understand
Business intelligence depends on a few ideas that help an organization define, measure, manage, and read its performance.
1. Key Performance Indicators (KPIs)
Key performance indicators are measurable values used to judge progress toward a specific business objective.
Examples include:
- Monthly recurring revenue.
- Customer retention rate.
- Customer acquisition cost.
- Employee turnover rate.
- Order fulfillment time.
- Operating profit margin.
A useful KPI connects directly to a business goal. Tracking too many unrelated measures makes it harder to see which results matter.
2. Business Metrics
Business metrics measure different parts of an organization's work. KPIs are the smaller set of metrics that matter most for judging progress toward objectives.
A retailer, for example, may watch website visits, average order value, number of transactions, product returns, and customer retention.
3. Benchmarks
A benchmark is a reference point for judging performance. Organizations may compare current results with their own history, internal targets, industry standards, or other relevant organizations.
A company might compare this year's customer retention rate with last year's to see whether retention work is improving.
4. Dimensions and Measures
In business reporting, a measure is a number you can analyze. A dimension is the context for that number.
Sales revenue is a measure. Region, product category, sales channel, and month are dimensions that show how revenue differs across the business.
5. Data Quality
Data quality is how accurate, complete, consistent, relevant, and reliable the information is. Poor data can produce a misleading conclusion even when the analysis itself is sound.
6. Data Governance
Data governance sets the responsibilities, standards, policies, and controls for managing organizational information. It helps keep data maintained, protected, and used properly.
7. Data-Driven Decision-Making
Data-driven decision-making means using relevant evidence when you weigh business options. It does not set experience or professional judgment aside. Data gives decisions another foundation, and a way to review them later.
Real-World Examples of Business Intelligence
Business intelligence is not only for technology companies or large enterprises. Organizations in many industries use business information to understand performance, improve services, manage resources, and find opportunities.
1. Retail and E-Commerce
Retail businesses generate information from transactions, customer accounts, product catalogs, inventory, returns, and promotions.
Example: An online retailer notices that revenue is growing, but repeat purchases are declining. By examining customer purchase frequency, product returns, and customer feedback, the business identifies that delivery delays are affecting customer satisfaction.
How BI helps:
- Understand customer purchasing behavior.
- Evaluate product and category performance.
- Monitor inventory and stock availability.
- Identify customer retention issues.
- Improve sales and inventory planning.
2. Banking and Financial Services
Financial institutions handle large amounts of information about transactions, accounts, customer activity, loans, operating expenses, and financial performance.
Example: A bank compares transaction patterns and account activity to identify unusual behavior that may require further investigation. Management also reviews branch-level operating costs and service performance.
How BI helps:
- Monitor financial performance.
- Analyze customer activity.
- Support risk monitoring.
- Evaluate branch and service performance.
- Improve management reporting.
3. Healthcare
Healthcare organizations use information about appointments, patient volumes, staffing, treatment services, equipment, and operating costs to manage their work.
Example: A hospital examines appointment schedules and patient volumes to identify periods of high demand. Management uses the findings to review staffing levels and improve scheduling.
How BI helps:
- Monitor service demand.
- Evaluate resource utilization.
- Identify operational bottlenecks.
- Review appointment and scheduling performance.
- Support administrative planning.
Sensitive patient information must be protected in accordance with applicable privacy, security, and healthcare requirements.
4. Manufacturing
Manufacturers use production records, equipment information, inventory, quality results, and supplier information to understand how operations are performing.
Example: A manufacturing company notices that production output is lower than expected. By comparing machine downtime, production schedules, material availability, and quality records, management identifies recurring equipment-related delays.
How BI helps:
- Monitor production performance.
- Identify recurring operational delays.
- Analyze product quality and defects.
- Evaluate inventory and supplier performance.
- Support maintenance and production planning.
5. Marketing and Advertising
Marketing teams collect information about website activity, campaign spending, customer engagement, leads, conversions, and sales outcomes.
Example: A marketing department compares lead generation costs across several campaigns. It discovers that one campaign attracts fewer leads but generates a higher proportion of qualified prospects. The team uses this information when planning future spending.
How BI helps:
- Evaluate campaign performance.
- Compare lead generation and conversion results.
- Understand customer engagement.
- Monitor marketing expenditure.
- Support budget allocation.
6. Human Resources
HR teams can use business intelligence to understand recruitment, employee retention, workforce planning, attendance, training, and organizational development.
Example: An organization reviews employee turnover across departments and compares it with tenure, recruitment trends, and employee feedback. The findings help HR identify teams that may need further investigation or retention support.
How BI helps:
- Monitor employee turnover.
- Evaluate recruitment performance.
- Understand workforce distribution.
- Review training participation.
- Support workforce planning.
Business Intelligence Tools and Technologies
Business intelligence depends on a wider set of technology. Different systems support different stages, from collecting and storing information to analyzing performance.
BI is not one software application. Organizations need to see the technology categories that work together.
1. Data Integration Technologies
Data integration technologies help an organization collect and combine information from different systems. They support workflows that move information into databases, warehouses, or analytical environments.
Examples include ETL platforms, data integration services, and cloud-based data pipelines.
2. Data Warehouses and Storage Platforms
Data warehouses and analytical storage platforms are where business information is organized and accessed. They support historical reporting, analytical queries, and data management.
3. Business Intelligence and Reporting Platforms
BI platforms help organizations analyze information, define metrics, prepare reports, and share what they find. Examples include Power BI, Tableau, Qlik Sense, Looker, and other enterprise reporting systems.
If you want to explore software used specifically for presenting information through visual reports and dashboards, see our guide to data visualization tools.
4. Database Query and Analysis Technologies
Database technologies and query languages let analysts retrieve, filter, combine, and summarize information. SQL is especially important when the data sits in relational databases and is structured.
5. Artificial Intelligence and Machine Learning
AI and machine learning can support more advanced work, such as finding unusual patterns, generating predictions, summarizing information, and helping with natural-language queries.
These technologies extend BI. They do not remove the need for reliable data, the right business context, or human review.
How Businesses Use BI Across Different Departments
Business intelligence is more useful when departments use the same information to understand their performance and coordinate decisions.
| Department | Information Analyzed | Business Application |
|---|---|---|
| Finance | Revenue, expenses, cash flow, budgets, and profitability. | Financial planning and cost management. |
| Sales | Orders, conversion rates, sales targets, and customer accounts. | Sales performance and revenue improvement. |
| Marketing | Campaign costs, leads, engagement, and conversions. | Campaign evaluation and marketing planning. |
| Human Resources | Recruitment, turnover, attendance, and training. | Workforce planning and employee retention. |
| Operations | Production, delivery times, inventory, and process performance. | Operational efficiency and resource planning. |
| Customer Service | Complaints, response times, satisfaction, and service requests. | Service quality and customer experience improvement. |
A company with falling profit may need information from finance, sales, marketing, and operations to understand why. Looking at one department alone may not show the full problem.
How to Implement Business Intelligence in an Organization
Putting business intelligence in place takes a clear view of organizational goals, the information available, the technology required, and the people who will use the results.
1. Start With a Specific Business Objective
Name a problem or opportunity BI should help with. Examples include reducing customer cancellations, improving inventory planning, monitoring operating expenses, or evaluating sales performance.
A specific objective keeps the project from producing reports nobody needs, and it ties the work to a result you can measure.
2. Identify Data Owners and Responsibilities
Decide which departments own the information the project needs. Assign responsibility for accuracy, access, definitions, and maintenance.
Clear ownership reduces confusion when different departments use the same metrics.
3. Assess Data Readiness
Check whether the required information is available, accurate, complete, and accessible. Look for missing records, inconsistent definitions, duplicate information, and systems that do not connect.
Fix data quality problems before you rely on the analytical results.
4. Establish Business Metrics and KPIs
Define the measurements that will show whether the work succeeded. Each KPI needs a clear definition, a calculation method, a data source, an owner, and a reporting frequency.
5. Build the Required Data Environment
Decide how information will be collected, integrated, stored, and accessed. The technical approach should fit the organization's size, data complexity, security needs, and available resources.
6. Develop the BI Process and Reports
Build the analysis and reporting workflows that answer the original business questions. Reports should be understandable, consistent, and relevant to the people who will use them.
7. Train Employees and Encourage Adoption
Employees need to know how metrics are defined and how to read the information. Training should focus on real business tasks, not only on software features.
8. Evaluate Results and Improve Continuously
Check whether the BI work is helping the organization meet its objectives. Review data quality, user adoption, how decisions are made, and business outcomes. Update the approach when requirements change.
Challenges and Limitations of Business Intelligence
Business intelligence can improve decisions, and the result still depends on how well the organization manages information, processes, technology, and people.
| Challenge | Business Impact | Recommended Approach |
|---|---|---|
| Poor data quality | Incorrect or incomplete information can produce misleading findings. | Establish data validation, cleaning, and quality standards. |
| Disconnected systems | Departments may work with inconsistent or incomplete information. | Improve data integration and establish consistent definitions. |
| Unclear business objectives | Teams may create reports that do not support important decisions. | Define business questions and measurable outcomes before implementation. |
| Lack of employee adoption | Employees may continue using manual processes or ignore available insights. | Provide training and involve users in the BI process. |
| Data security and privacy | Sensitive information may be exposed or used improperly. | Apply access controls, security policies, and data governance. |
| Misinterpretation of findings | Decisions may be based on incomplete analysis or incorrect assumptions. | Validate results and include appropriate business context. |
| Maintenance and scalability | BI processes may become difficult to manage as data and business needs grow. | Review architecture, processes, and capacity regularly. |
Business intelligence cannot guarantee a better decision on its own. It works when the information is sound, the analysis is relevant, and decision-makers know how to use what they find.
How Artificial Intelligence Is Changing Business Intelligence
Artificial intelligence is changing how organizations work with business information. AI-enabled tools can help analysts explore datasets, find patterns, summarize findings, and look into business questions more quickly.
AI does not replace business intelligence. It can extend it by helping with selected analytical tasks.
1. Natural-Language Business Questions
Some AI-enabled systems let people ask questions in everyday language instead of writing every query by hand. A manager might ask which product category generated the highest revenue in a given period.
The system may help turn that question into a query, or it may show the relevant information, depending on what it can do and how the data is modeled.
2. Automated Pattern Identification
AI can help find unusual changes, recurring patterns, and relationships that deserve a closer look. Those findings help analysts decide where to spend their time.
3. Predictive Business Insights
Machine learning models can use historical information to estimate future outcomes, such as customer demand, sales trends, or which customers may cancel.
Treat predictions carefully. Their reliability depends on data quality, whether the model fits the question, and whether business conditions stay the same.
4. Faster Analysis and Reporting
AI tools can help summarize a dataset, draft a first description of a report, suggest questions to ask, and support parts of the reporting process.
5. Better Access to Business Information
Natural-language interfaces and AI assistants can make some analytical information easier for non-technical users to explore. Organizations still need access controls and reliable definitions for their metrics.
Important: AI-generated summaries, recommendations, and predictions should be reviewed before they influence business decisions. Human judgment, accurate information, and business context remain essential.
Business Intelligence Career Opportunities
As more organizations rely on data to understand performance and run operations, people who can organize, analyze, and explain business information are useful across many industries.
Business intelligence careers mix technical skill with business understanding. The work changes with the role and with how mature the organization's analytics are.
1. Business Intelligence Analyst
A BI analyst works with business stakeholders to understand what reports are needed, analyze organizational information, define metrics, and explain the findings.
Common responsibilities:
- Understanding business reporting requirements.
- Analyzing organizational performance.
- Defining and monitoring KPIs.
- Preparing reports and analytical findings.
- Supporting business decision-making.
2. Business Intelligence Developer
A BI developer works on the technical side. That can include building data models, creating reporting solutions, integrating data sources, and maintaining the BI environment.
Common responsibilities:
- Developing BI solutions.
- Building data models and reporting workflows.
- Connecting data sources.
- Maintaining analytical systems.
- Supporting performance and reporting requirements.
3. Business Intelligence Manager
A BI manager coordinates business intelligence work and helps keep the analysis aligned with organizational priorities.
Common responsibilities:
- Managing BI projects and teams.
- Establishing reporting priorities.
- Coordinating with business departments.
- Overseeing data governance and reporting standards.
- Aligning BI activities with business goals.
4. Business Analyst
A business analyst looks at business needs, reviews processes, finds opportunities to improve, and helps stakeholders define a suitable solution. The role may include business intelligence and data analysis, depending on the organization.
5. Data Analyst
A data analyst collects, cleans, examines, and interprets information to answer business questions. Data analysts may work with SQL, spreadsheets, statistical methods, programming languages, and reporting platforms.
Skills Needed for Business Intelligence Roles
People interested in business intelligence can build the following skills:
- Data analysis: Understanding datasets, identifying patterns, and interpreting findings.
- SQL: Retrieving, filtering, joining, and summarizing information from databases.
- Business understanding: Connecting analytical work with organizational goals and business problems.
- Data management: Understanding data quality, preparation, integration, and governance.
- BI platforms: Working with business intelligence and reporting environments.
- Statistical thinking: Understanding comparisons, trends, variation, and analytical limitations.
- Communication: Explaining findings clearly to technical and non-technical stakeholders.
- AI awareness: Understanding how AI and machine learning can support analytical workflows.
A mix of technical skill and business understanding prepares learners for different data-focused career paths.
Frequently Asked Questions About Business Intelligence
1. What is business intelligence in simple words?
Business intelligence is the practice of collecting, organizing, analyzing, and interpreting business information so an organization can understand its performance and decide with better information.
2. What is the main purpose of business intelligence?
The main purpose is to turn business information into useful insight. Organizations use BI to monitor performance, find problems, weigh opportunities, and support better decisions.
3. What are the four types of business intelligence?
Four useful categories are strategic, tactical, operational, and analytical business intelligence. Strategic BI supports long-term planning, tactical BI supports departmental decisions, operational BI monitors daily activities, and analytical BI examines information in more detail.
4. What are examples of business intelligence?
Examples include analyzing sales performance, monitoring customer retention, evaluating operating expenses, reviewing employee turnover, examining production efficiency, and identifying changes in market demand.
5. What is the difference between business intelligence and traditional reporting?
Traditional reporting generally presents recorded business information. Business intelligence goes further by connecting information, examining performance, investigating changes, and supporting business decisions.
6. What is the business intelligence lifecycle?
The BI lifecycle generally includes defining business questions, collecting information, integrating and preparing data, analyzing results, interpreting findings, taking action, and measuring outcomes.
7. What are KPIs in business intelligence?
Key performance indicators are measurable values used to judge progress toward a specific business objective. Examples include revenue growth, customer retention, operating costs, and order fulfillment time.
8. Which industries use business intelligence?
Business intelligence is used in retail, e-commerce, banking, finance, healthcare, manufacturing, education, marketing, logistics, and many other industries.
9. Is business intelligence the same as data analytics?
No. Business intelligence focuses on using information to understand business performance and support organizational decisions. Data analytics is the broader practice of examining information to find patterns, relationships, and insights. The two overlap in many practical applications.
10. How does artificial intelligence support business intelligence?
AI can assist with natural-language queries, pattern identification, predictive analysis, automated summaries, and data exploration. These capabilities can improve analytical workflows, and the results should still be checked.
11. What skills are needed for a business intelligence career?
Useful skills include SQL, data analysis, data management, business understanding, statistical thinking, reporting, communication, and familiarity with business intelligence technologies.
12. Can beginners learn business intelligence?
Yes. Beginners can start with data fundamentals, spreadsheets, SQL, analytical thinking, and business reporting. They can then add BI platforms, data modeling, and AI-assisted analytics.
Build Your Business Intelligence and Data Analytics Skills with WorkForce Institute
Business intelligence helps an organization see what is happening across its operations and use that information to decide better. Building that skill takes more than one software application. It means understanding data, preparing information, analyzing results, and explaining what the numbers mean. The Generative AI Data Analyst program at WorkForce Institute covers practical data analysis and how modern analytical technology supports that work, including data preparation, reporting, and AI-supported workflows.
If a fixed schedule does not fit, the self-paced Generative AI Data Analyst program covers the same skills on a timeline you set yourself.