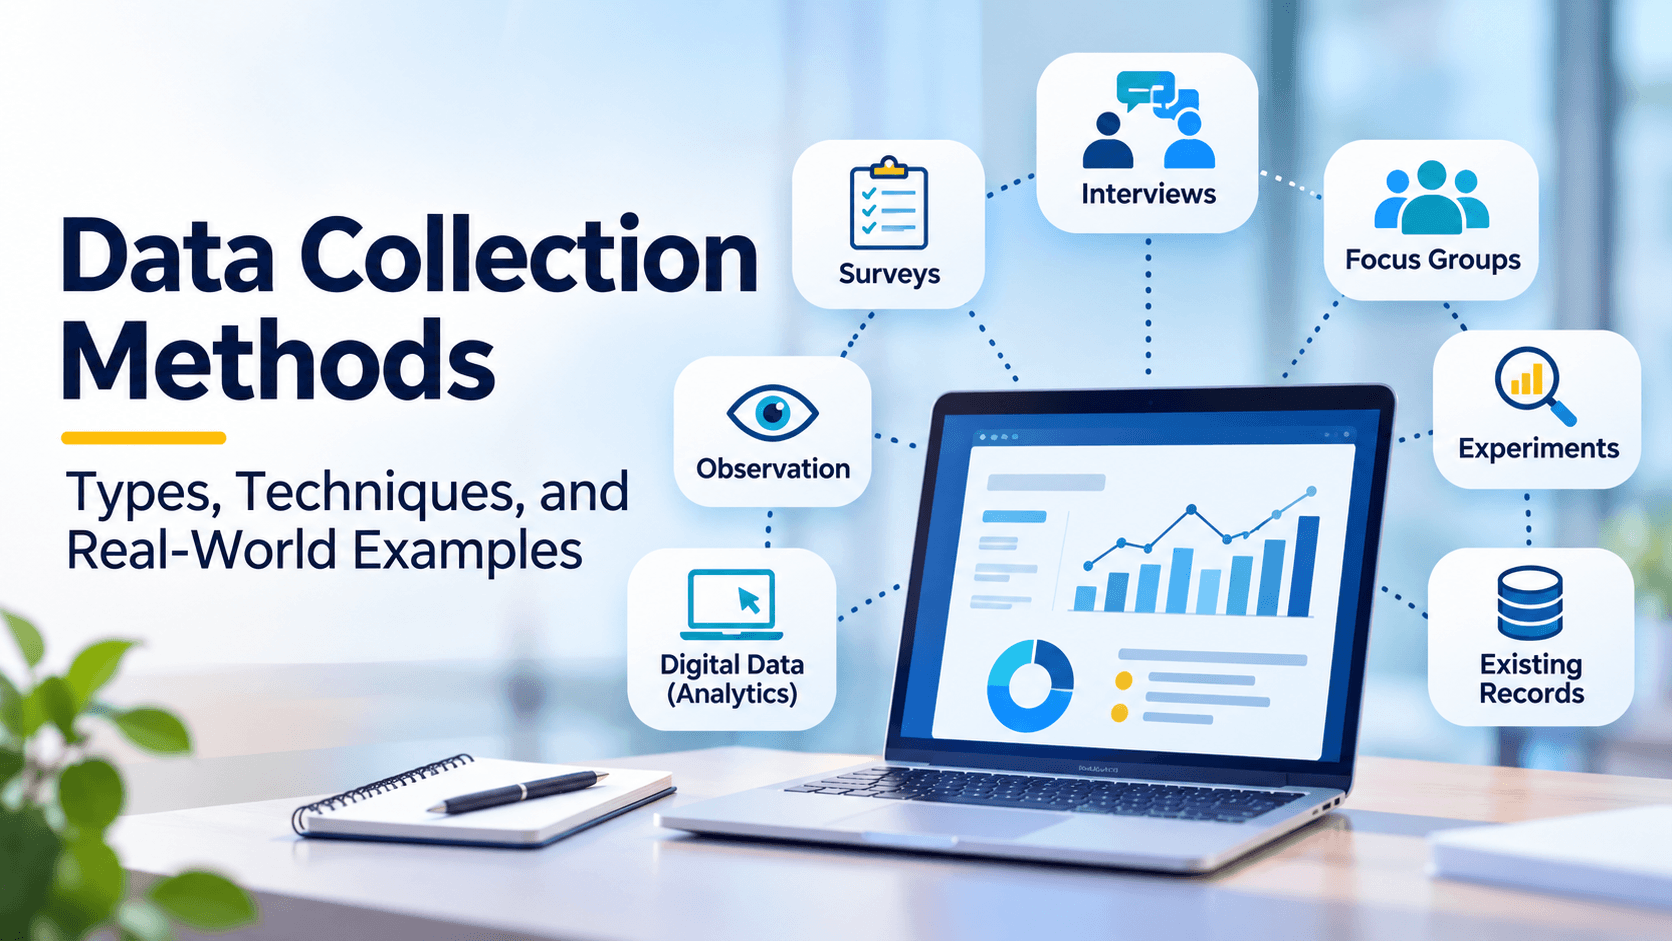
Every useful data-driven decision starts with information you can trust. If a business wants to understand customers, improve a product, measure how people are performing, or spot a market trend, it first has to collect the right data. Choosing the right data collection methods is part of research, business analysis, and data analytics.
Data collection is gathering and measuring information from relevant sources so you can answer a question, look into a problem, and support a decision. Depending on the goal, an organization might use surveys, interviews, observations, experiments, existing records, or digital tools.
A large pile of data does not automatically become a useful insight. The information has to be relevant, accurate, consistent, and collected responsibly. This guide covers the main types of data collection methods, when to use each one, and practical examples from different industries.
What Are Data Collection Methods?
Data collection methods are the techniques used to gather information for research, analysis, and decisions. They pull information from people, systems, transactions, documents, experiments, and other sources.
An online retailer looking at falling sales might survey customers, review website analytics, interview buyers, and look at past sales records. Each method shows a different side of the problem.
The right approach depends on several factors:
- Research objective: What question are you trying to answer?
- Type of information: Do you need numerical data, descriptive feedback, or both?
- Target audience: Who or what will provide the information?
- Available resources: How much time, budget, and technology can you use?
- Data quality: How accurate, complete, and reliable must the information be?
- Privacy requirements: What permissions, consent, and safeguards are necessary?
Those factors help you pick a method that produces information you can actually analyze.
Why Are Data Collection Methods Important?
Reliable collection gives an organization a stronger base for understanding a problem and deciding what to do. Poorly collected information leads to misleading conclusions, inaccurate reports, and strategies that do not work.
Here are some important reasons to choose the right data collection techniques:
1. Supports Better Decision-Making
Organizations use collected information to see patterns, compare performance, understand what customers need, and judge opportunities. Reliable data lets people decide from evidence, not from a guess.
Organizations can build stronger analytical practices by making data part of everyday business decisions. Learn more in our article Leading with Data: How Executives Can Champion a Data-Driven Culture.
2. Improves Research Accuracy
A method that fits the question helps researchers gather information that actually relates to it. Clear questions, a suitable sample, and a consistent procedure cut errors and make the findings more useful.
3. Helps Understand Customer Behavior
Surveys, interviews, customer feedback, and website analytics help a business see what customers want, what influences a purchase, and where people get stuck.
4. Identifies Trends and Patterns
Collecting information over time shows changes in preferences, sales, employee engagement, market demand, and how efficiently the operation runs.
5. Provides a Foundation for Data Analytics and AI
Data analytics and machine learning depend on suitable input. Incomplete, inconsistent, or poorly collected information makes the analysis and the models unreliable. A structured collection process prepares the data for later analysis and for AI.
Types of Data Collection Methods
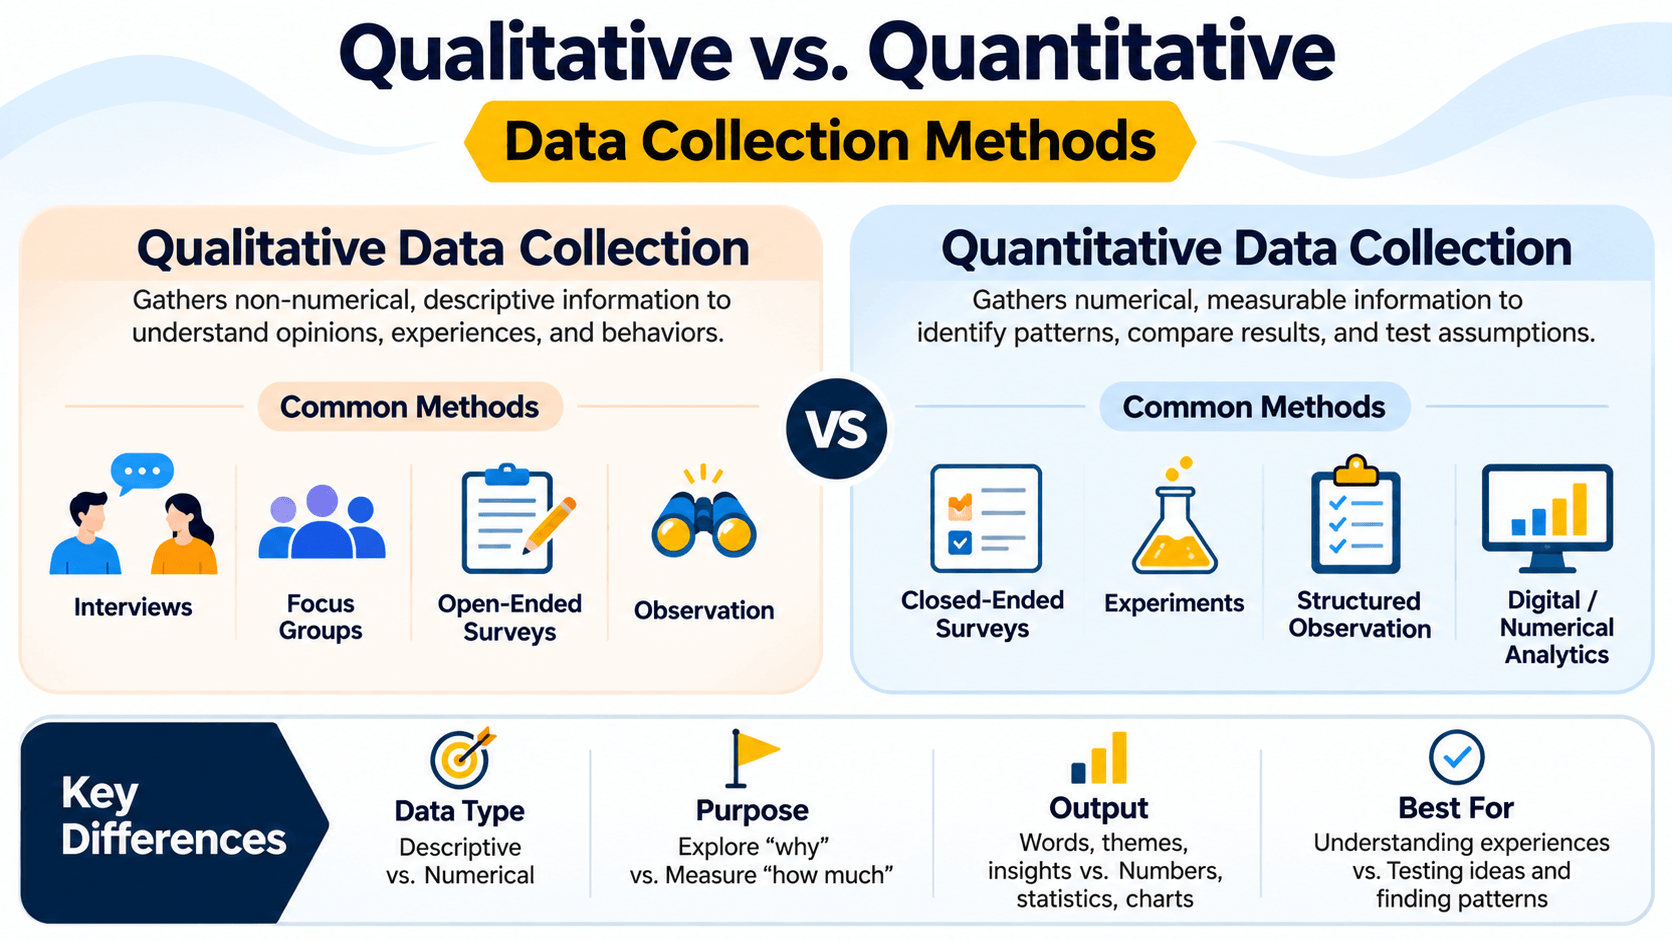
Data collection methods are usually grouped into qualitative and quantitative. They serve different purposes, and researchers often use both to understand a topic more fully.
1. Qualitative Data Collection Methods
Qualitative collection looks at experiences, opinions, motivations, attitudes, and behavior. It usually produces description, not numbers.
These methods help when you want to know why people act a certain way, or how they experience a product, a service, or a situation.
Common qualitative techniques include:
Interviews
Interviews ask people about their experience, opinion, or knowledge of a subject. They can be structured, semi-structured, or unstructured.
Example: A company interviews customers who stopped using its subscription service to understand why they cancelled their accounts.
Best for: Detailed feedback, individual experiences, customer research, and exploratory studies.
Focus Groups
A focus group is a guided discussion with a small group about a product, service, idea, or experience. A moderator steers the conversation and asks people to share different views.
Example: A software company invites a group of users to discuss a proposed dashboard redesign before launching it.
Best for: Exploring opinions, testing concepts, understanding preferences, and generating ideas.
Open-Ended Surveys
Open-ended surveys let people answer in their own words instead of picking from a fixed list. That can surface concerns and suggestions a multiple-choice question would miss.
Example: An online learning platform asks students, "What would improve your learning experience?" and reviews their written responses.
Best for: Collecting detailed feedback from a larger audience without restricting responses to fixed choices.
Observation
Observation means watching and recording behavior, activity, or events in a natural or controlled setting. Researchers may watch directly or use an approved recording or tracking system.
Example: A retail business observes how customers move through a store to identify areas where product placement or navigation could be improved.
Best for: Studying actual behavior, workflows, interactions, and user experiences.
2. Quantitative Data Collection Methods
Quantitative collection focuses on information you can measure and express as numbers. It helps you compare results, find statistical patterns, test a hypothesis, and measure change.
Common quantitative techniques include:
Closed-Ended Surveys and Questionnaires
Closed-ended surveys use predefined options, such as multiple-choice questions, rating scales, and yes-or-no questions. Responses are easier to organize and compare across people.
Example: A training provider asks students to rate their course experience from 1 to 5.
Best for: Measuring satisfaction, preferences, opinions, and trends across a defined audience.
Experiments
An experiment changes one or more variables under controlled conditions to measure the effect on an outcome. It is useful for testing a hypothesis and seeing whether a change produces a measurable result.
Example: An e-commerce business tests two versions of a checkout page to determine which one produces a higher purchase completion rate.
Best for: Testing hypotheses, measuring the impact of changes, and evaluating cause-and-effect relationships under an appropriate experimental design.
Structured Observation
Structured observation uses predefined categories, checklists, or measurement criteria so behavior is recorded the same way each time. It focuses on specific actions or measurable events, unlike open-ended observation.
Example: A warehouse records the number of orders processed per hour to measure operational productivity.
Best for: Measuring frequency, duration, performance, and repeatable activities.
Digital and System-Generated Data
Digital platforms and business systems generate information through user interactions, transactions, application events, and operations. That information can be collected through approved analytics platforms, databases, application logs, and monitoring systems.
Example: An online store collects page views, product clicks, cart additions, completed purchases, and checkout abandonment events.
Best for: Monitoring digital activity, analyzing customer journeys, measuring performance, and identifying usage patterns.
Primary vs. Secondary Data Collection
Another useful split is whether you collect the information yourself for this question, or you use sources that already exist. That is the difference between primary and secondary data.
Primary Data Collection
Primary data is collected directly from original sources for a particular research question or business objective. The researcher or organization runs the collection and can shape it around the information they need.
Common primary data collection techniques include:
- Surveys and questionnaires
- One-on-one interviews
- Focus group discussions
- Direct observation
- Experiments and controlled tests
- Customer feedback forms
Example: A company wants to understand customer satisfaction with a recently launched product. It creates a survey and collects responses directly from customers.
Advantages:
- Information is collected for a specific objective.
- The organization has greater control over the collection process.
- Questions and measurements can be customized.
- Researchers can collect current information.
Limitations:
- Collection can require significant time and resources.
- Recruiting suitable participants may be difficult.
- Poorly designed questions can introduce bias.
Secondary Data Collection
Secondary data has already been collected, recorded, or published by someone else. Researchers reuse it to answer a new question or to add context to the analysis.
Common secondary data sources include:
- Government reports and public datasets
- Academic research papers and published studies
- Company records and historical sales reports
- Industry reports and market research
- Public databases and statistical publications
- Existing website and platform analytics reports
Example: A business planning to enter a new market reviews published industry reports, census statistics, and publicly available market data to understand demand.
Advantages:
- Often faster and less expensive than collecting new information.
- Can provide historical context and long-term trends.
- Allows researchers to compare findings across different sources.
Limitations:
- The information may not match the exact research objective.
- Data may be outdated or incomplete.
- Collection methods and definitions may differ between sources.
- Researchers may have limited control over data quality.
Primary vs. Secondary Data: Key Differences
| Comparison | Primary Data | Secondary Data |
|---|---|---|
| Source | Collected directly from original sources | Obtained from existing sources |
| Purpose | Gathered for a specific research objective | Originally collected for another purpose |
| Control | Greater control over collection and measurement | Limited control over original collection |
| Time | Usually requires more time | Often quicker to obtain |
| Cost | Can be more expensive | Can be less expensive |
| Examples | Interviews, surveys, experiments | Reports, public datasets, historical records |
Common Data Collection Techniques and When to Use Them
The technique you pick depends on the question, the information you need, and the people or systems you can reach. This comparison can help you choose.
| Method | Type of Data | Useful For | Example |
|---|---|---|---|
| Surveys | Qualitative or quantitative | Collecting feedback from many participants | Customer satisfaction survey |
| Interviews | Primarily qualitative | Understanding individual experiences | Interviewing customers about product issues |
| Focus groups | Primarily qualitative | Exploring opinions and shared experiences | Testing a new product concept |
| Observation | Qualitative or quantitative | Studying real-world behavior | Observing customer movement in a store |
| Experiments | Primarily quantitative | Testing changes and hypotheses | Comparing two website layouts |
| Existing records | Qualitative or quantitative | Analyzing historical information | Reviewing previous sales reports |
| Digital analytics | Primarily quantitative | Measuring online activity | Tracking website conversions |
Real-World Examples of Data Collection Methods
The methods are easier to picture when you see how organizations use them on real problems.
1. E-Commerce: Understanding Customer Behavior
An online retailer notices that many visitors add products to their carts and then do not buy. To look into it, the company combines several methods:
- Website analytics: Tracks product views, cart additions, and checkout abandonment.
- Customer surveys: Collects feedback about pricing, delivery, and payment options.
- Customer interviews: Explores the reasons behind purchasing difficulties.
- Transaction records: Identifies patterns in completed and abandoned orders.
Together, those sources can show where the purchase process is getting in the way, and which fixes to try first.
2. Education: Measuring Student Learning Experience
A school or training provider wants to understand how students experience an online course. It collects information through:
- Student satisfaction questionnaires
- Interviews with selected learners
- Course attendance and completion records
- Learning platform engagement data
- Assessment scores and feedback
Those sources help the institution see who is participating, where learners get stuck, and how to improve the course.
3. Healthcare: Monitoring Patient Outcomes
A healthcare research team studies patient recovery after a particular treatment. Depending on the approved research design, it may collect:
- Patient-reported outcomes through questionnaires
- Clinical measurements recorded by healthcare professionals
- Relevant medical history from authorized records
- Follow-up observations over a defined period
Researchers can analyze those measurements to understand outcomes and look for patterns. Healthcare data needs strict privacy protections, the right authorization, and compliance with the rules that apply.
4. Marketing: Evaluating Campaign Performance
A marketing team wants to know whether a new campaign is reaching the right audience. It may collect:
- Website traffic and landing-page engagement
- Ad impressions, clicks, and conversion data
- Customer survey responses
- Sales and lead-generation records
- Social media engagement metrics
Reading those sources together shows how the campaign performed and where targeting or messaging could improve.
5. Manufacturing: Improving Operational Efficiency
A manufacturer wants to reduce production delays and find equipment problems that keep coming back. It can collect:
- Machine sensor readings
- Production output measurements
- Equipment maintenance records
- Quality inspection results
- Employee observations and incident reports
Analyzed together, those records can show the recurring issues and where an improvement is worth investigating.
How to Choose the Right Data Collection Method
No single method fits every situation. The best choice depends on the question, the kind of information you need, and the resources you have.
Follow these steps to select an appropriate approach:
Step 1: Define Your Objective
Start with what you want to learn. A clear objective makes it easier to tell which information is relevant.
"Understand why customers cancel subscriptions" is more useful than "collect customer data."
Step 2: Identify the Data You Need
Decide whether you need qualitative information, quantitative measurements, or both. A rating-scale survey can measure satisfaction. Interviews can explain the reasons behind it.
Step 3: Identify Your Data Sources
Decide where the information can come from. Sources can include customers, employees, business systems, public datasets, research publications, and operational records.
Step 4: Select the Collection Technique
Choose the method that fits the objective, the audience, and the resources you have. You can use one technique, or combine several, to see the situation more fully.
Step 5: Design Your Collection Process
Prepare the survey questions, interview guides, observation checklists, measurement criteria, or data extraction steps. Keep the process consistent so the information can be compared and analyzed.
Step 6: Collect and Validate the Data
Gather the information using the procedure you designed. Check for missing values, duplicate records, inconsistent formats, invalid responses, and other quality problems.
Step 7: Organize the Data for Analysis
Store and structure the information in a format you can work with. Depending on the project, that may be a spreadsheet, a database, an analytics platform, or a specialized data tool.
Once the information is prepared, you can look for patterns, build visualizations, and develop insights. For the next stage, read our guide on how to analyze data with Generative AI.
Best Practices for Effective Data Collection
A consistent process improves the quality and usefulness of what you collect. These practices help:
Use Clear and Relevant Questions
Write questions that support the research objective. Skip confusing language, leading questions, and questions that will not be used in the analysis.
Choose an Appropriate Sample
The people, records, or observations in the study should represent the group or subject you want to understand. The wrong sample produces misleading findings.
Maintain Consistency
Use the same definitions, units, procedures, and formats. That makes it easier to compare information from different sources or from different times.
Check Data Quality
Before you analyze, review the information for missing values, duplicates, inaccuracies, outdated records, and inconsistent entries.
Protect Privacy and Obtain Appropriate Consent
Explain why the information is being collected and how it will be used. Collect only what you need, limit access to sensitive information, and follow the privacy laws and organizational policies that apply. Get consent, or another required authorization, where it is needed.
Document the Process
Record where the data came from, when it was collected, how it was gathered, and any limits that affect how it should be read. Good documentation makes the work transparent and easier to repeat.
How AI Is Changing Data Collection and Preparation
Artificial intelligence is changing how organizations work with information. It does not replace a well-designed collection process. It can support several tasks that happen before and during analysis.
Depending on the tools, the data, and the workflow, AI can help with:
- Survey analysis: Grouping open-ended responses into common themes.
- Data organization: Helping classify information and identify inconsistent entries.
- Data quality checks: Supporting the identification of missing values, unusual patterns, and possible duplicates.
- Text analysis: Summarizing large volumes of customer feedback, reviews, and support messages.
- Data exploration: Helping analysts investigate patterns and generate questions for further analysis.
Review what AI suggests. Analysts still need to check results against the original information, understand possible bias, and avoid treating a generated output as a confirmed fact.
To see how AI can support analytical work, read Unleash Generative AI for Smarter Data Analysis.
Common Challenges in Data Collection
Even a well-chosen method can run into problems. Spotting them early reduces the damage.
Incomplete or Missing Data
People skip questions, systems fail to record an event, or old records are incomplete. Set up checks, and document what is missing, instead of filling gaps with unsupported assumptions.
Sampling Bias
If the people or records you selected do not represent the group you are studying, the results can mislead. Define the target population and choose a sampling approach that fits it.
Inconsistent Data Formats
Information from different sources may use different date formats, names, units, or categories. Standardizing and preparing the data makes it easier to combine and analyze.
Privacy and Security Risks
Collecting personal or sensitive information creates a duty to protect it. Use access controls, secure storage, data minimization, and a retention policy.
Limited Time and Resources
Interviews, experiments, and large surveys take real resources. Prioritize the information the objective actually needs, and pick a method that fits the budget and the timeline.
Frequently Asked Questions About Data Collection Methods
What are the 4 main methods of data collection?
Four methods people use often are surveys, interviews, observation, and experiments. Researchers also use focus groups, existing records, and digital sources, depending on the objective.
What are the two main types of data collection?
The two broad types are qualitative and quantitative. Qualitative methods gather description of experiences and opinions. Quantitative methods collect information you can measure and analyze as numbers.
What is the difference between primary and secondary data?
Primary data is collected directly from original sources for a specific purpose. Secondary data already exists, such as published reports, historical records, public datasets, and earlier research.
Which data collection method is best?
It depends on the objective. Surveys can collect responses from many people. Interviews give detailed individual feedback. Observation helps you study behavior. Experiments can test the effect of a specific change.
Can multiple data collection methods be used together?
Yes. Using more than one method can give a fuller picture. A business might use website analytics to find a problem and customer interviews to understand why it happens.
How does data collection support data analytics?
Collection supplies the information analysts use to find patterns, measure performance, build visualizations, and support decisions. The quality and relevance of that data shape how reliable the analysis is.
How is AI used in data collection?
AI can help organize information, analyze text responses, flag possible quality issues, and support exploration. A person still needs to check the results, protect privacy, and look for bias.
Build Your Data Analytics Skills with WorkForce Institute
Understanding data collection methods is an important first step toward working as a data analyst. Collecting information is only one part of the job. You also need to prepare datasets, analyze them, use visualization tools, and explain what you found.
The Generative AI Data Analyst program at WorkForce Institute helps learners build practical skills in AI, data analytics, machine learning, and data visualization. The curriculum includes data collection and preparation, data exploration, and other core analytical concepts.
Whether you are starting in analytics or adding to skills you already have, the program shows how AI-powered tools can support modern data work.
You can also look at the flexible self-paced Generative AI Data Analyst program and learn on a schedule that fits you.
Start building the skills to turn raw information into meaningful insights with WorkForce Institute.