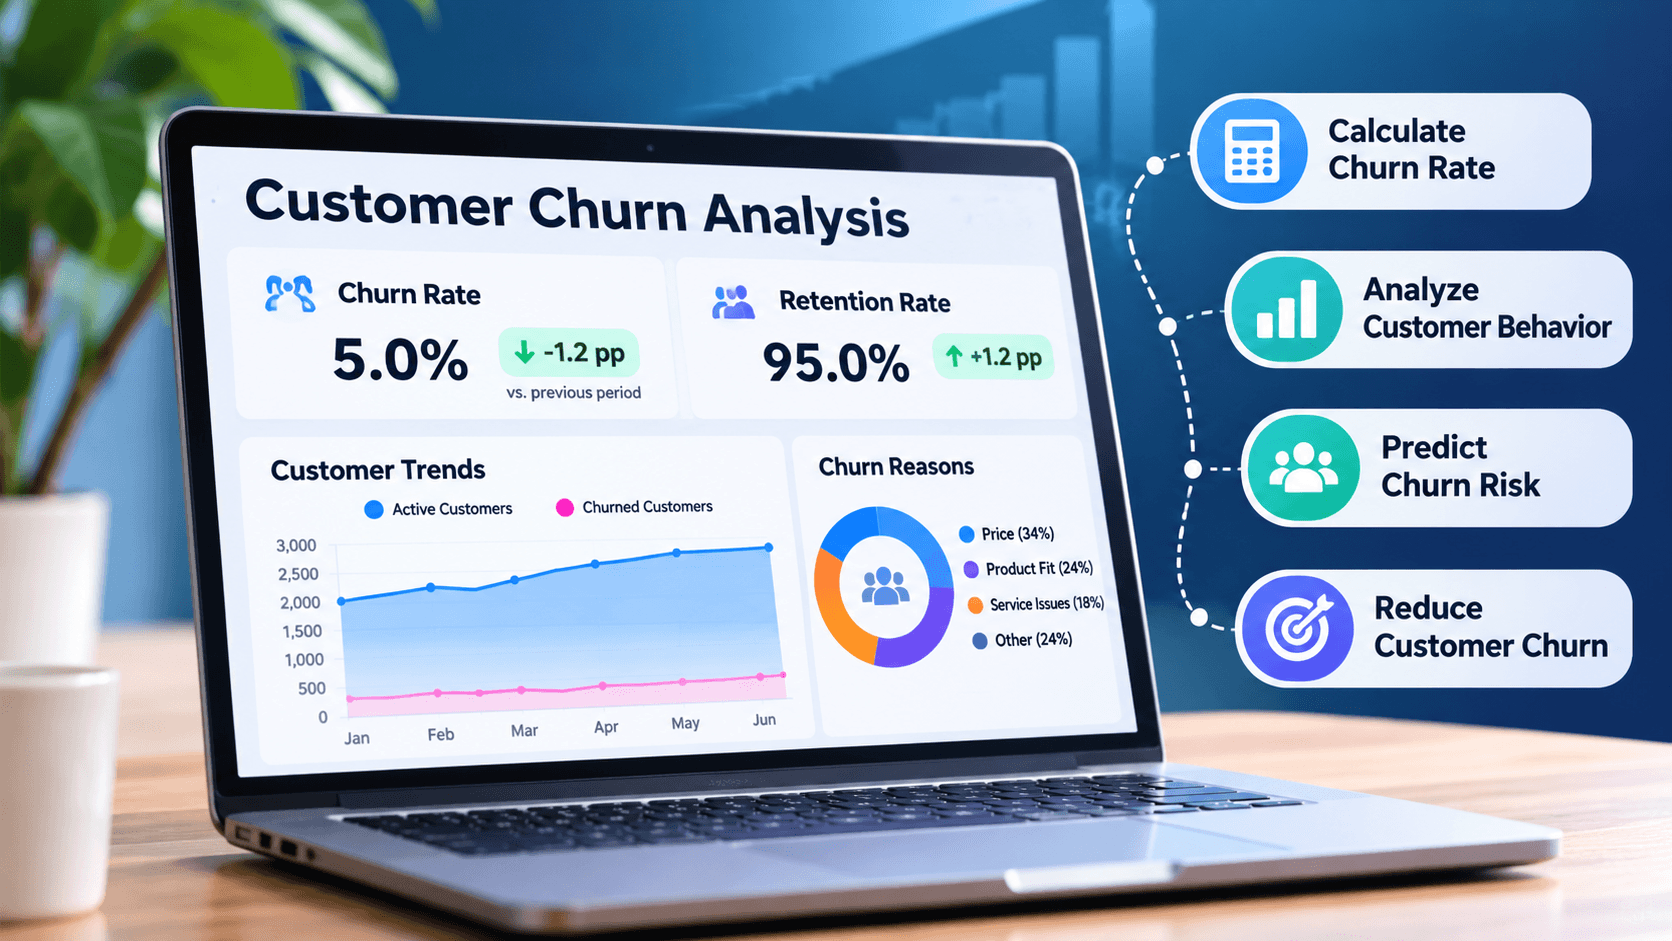
Customer retention shapes long-term growth. New customers help a business expand. Customers who stay support recurring revenue, stronger relationships, and growth that can last. A business needs to know how many customers it gains and how many it loses.
Churn rate analysis measures customer loss, finds patterns behind cancellations, and shows which customers may be about to leave. Behavior, purchase history, engagement, and feedback give a company a clearer basis for retention decisions.
Data analytics and predictive tools make that work more practical. Businesses can use Excel, SQL, Python, and machine learning models to study customer data, spot warning signs, and build retention plans for specific groups.
This guide explains what churn rate analysis means, how to calculate customer churn, which metrics to watch, and how data analytics and predictive analytics can reduce customer loss.
What Is Churn Rate Analysis?
Churn rate analysis measures and examines the percentage of customers who stop doing business with a company in a set period. It shows how many customers were lost and helps the team look into why.
A subscription business may lose customers because of price, weak support, limited features, or a competitor's offer. Customer data can show the common reasons for cancellation and where the business should improve.
Churn rate analysis is particularly useful for businesses that depend on recurring customers, including:
- Software-as-a-Service (SaaS) companies
- Subscription-based services
- Telecommunications providers
- Financial institutions
- E-commerce businesses
- Online learning platforms
- Membership-based organizations
The analysis lets a business decide from measured customer behavior instead of assumptions.
Why Is Customer Churn Important for Businesses?
Customer churn affects revenue, profit, relationships, and growth. When customers leave, the company often spends more to replace them. If losses continue, new customers may not be enough to keep growth sustainable.
Understanding churn helps businesses:
- Protect recurring revenue: Retaining existing customers helps maintain predictable revenue streams.
- Improve customer experience: Analyzing complaints and behavior can reveal problems in products, services, or support.
- Identify business weaknesses: Churn patterns may expose pricing issues, poor onboarding, or product limitations.
- Improve customer lifetime value: Stronger retention can increase the value generated by customer relationships over time.
- Make better decisions: Data-driven insights help businesses prioritize retention activities and allocate resources effectively.
Churn is not only a sales or marketing problem. It can also point to product quality, customer service, user experience, or the value the business offers.
How to Calculate Churn Rate
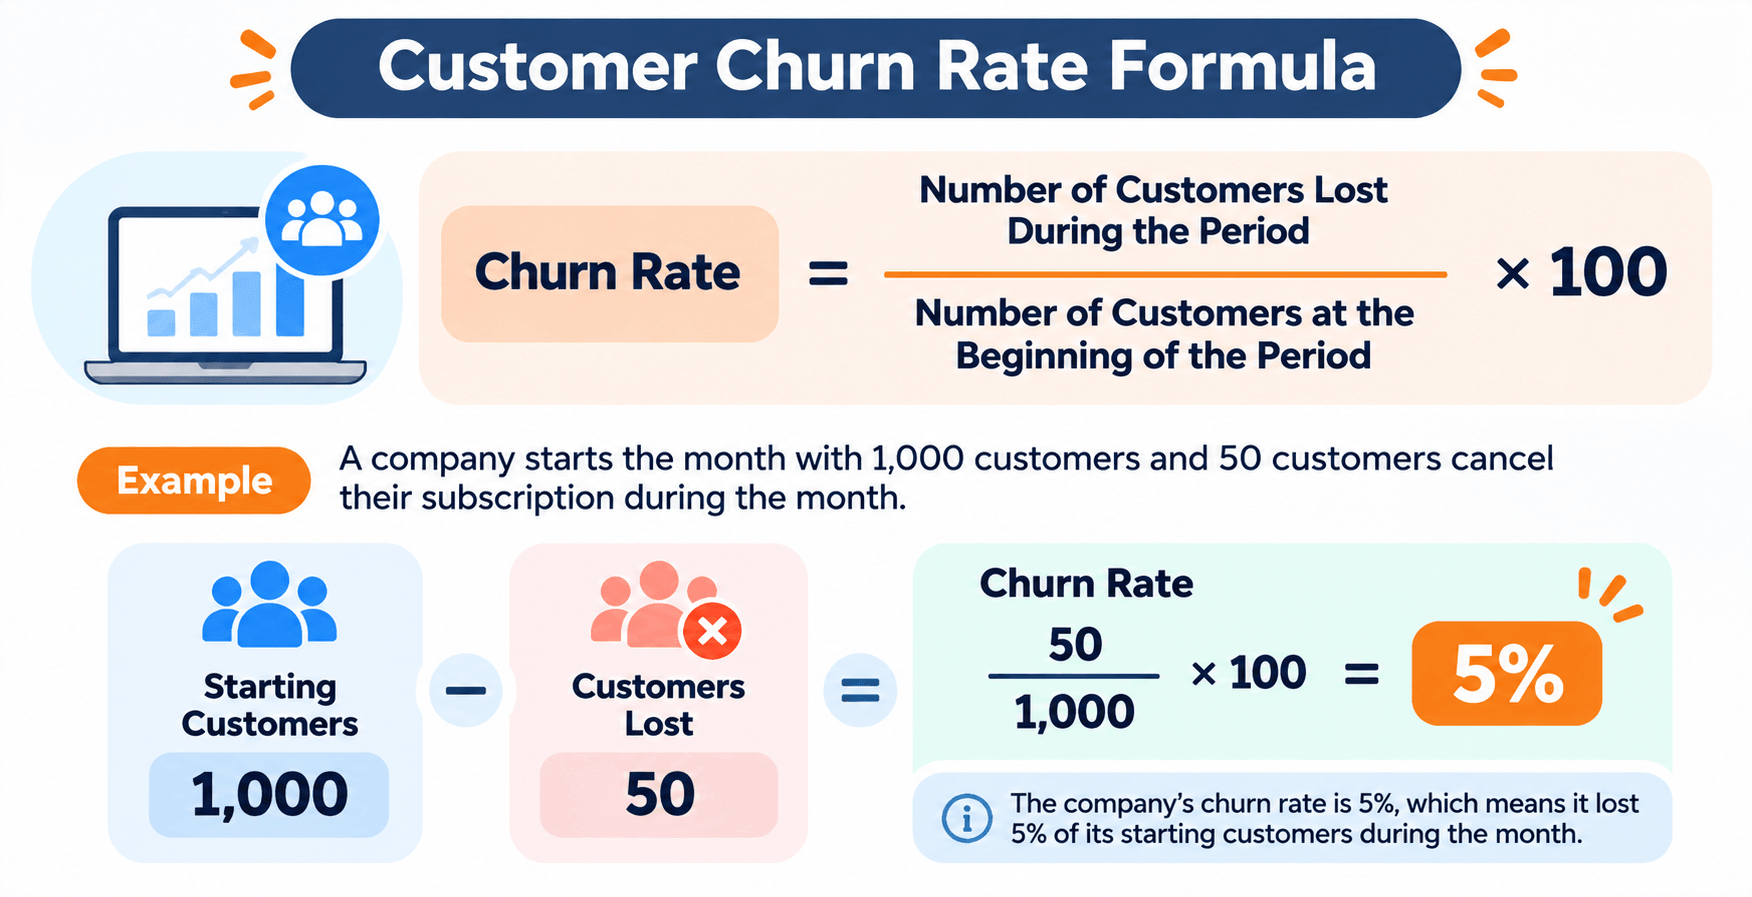
Calculating churn rate is one of the first steps. The basic formula compares customers lost in a period with the number of customers at the start of that period.
Customer Churn Rate Formula
Customer Churn Rate = (Number of Customers Lost During the Period / Number of Customers at the Beginning of the Period) × 100A subscription company starts the month with 1,000 customers. During that month, 50 customers cancel.
Churn Rate = (50 / 1,000) × 100 = 5%
The monthly customer churn rate is 5%. The company lost 5% of its starting customer base that month.
Another Customer Churn Example
An online learning platform starts a quarter with 2,500 active subscribers. By the end of the quarter, 125 customers have discontinued their subscriptions.
Churn Rate = (125 / 2,500) × 100 = 5%
The quarterly customer churn rate is 5%.
Define the measurement period clearly and use the same method every time. When you calculate basic customer churn, do not add new customers acquired during the period to the starting customer count.
Types of Customer Churn
Customers leave for different reasons. Knowing the type of churn helps a business find the underlying problem and choose a response that fits.
1. Voluntary Churn
Voluntary churn happens when a customer chooses to stop using a product or service. Price, a poor experience, changing needs, or dissatisfaction can all lead to that choice.
A customer may cancel a software subscription because a competitor offers similar features at a lower price.
2. Involuntary Churn
Involuntary churn happens when a customer loses access without choosing to leave. Payment failures, expired credit cards, billing problems, or a renewal that does not go through can cause it.
Payment reminders, automated retry systems, and clear billing notices can reduce this type of churn.
3. Customer Churn
Customer churn measures the number or percentage of customers who stop doing business with an organization during a particular period.
Subscription services and businesses with ongoing customer relationships use it often.
4. Revenue Churn
Revenue churn measures the recurring revenue lost from existing customers during a specific period. It matters for subscription businesses because losing one high-value customer can cost more than losing several smaller accounts.
Depending on the method, revenue churn can also include changes in subscription value.
Customer Churn Rate vs. Customer Retention Rate
Customer churn rate and customer retention rate are closely related. They measure different outcomes.
- Customer churn rate: Measures the percentage of customers lost during a specific period.
- Customer retention rate: Measures the percentage of starting customers who remain customers during that period.
A basic customer retention rate formula is:
Customer Retention Rate = ((Customers at the End of the Period - New Customers Acquired During the Period) / Customers at the Beginning of the Period) × 100A business starts with 1,000 customers, acquires 100 new customers, and ends the month with 1,050 customers.
Retention Rate = ((1,050 - 100) / 1,000) × 100 = 95%
The business retained 95% of its starting customer base. Under these basic definitions and consistent customer-count rules, the retention rate and churn rate complement each other.
Key Metrics Used in Churn Rate Analysis
Churn rate alone does not explain why customers leave. Other metrics show how customers behave and where retention can improve.
1. Customer Retention Rate
Customer retention rate shows how well a business keeps its existing customers. Watching it over time shows whether retention work is helping.
2. Customer Lifetime Value (CLV)
Customer Lifetime Value estimates the total value a business expects from a customer across the relationship. Looking at CLV next to churn shows the financial cost of losing customers.
3. Monthly Recurring Revenue (MRR) Churn
MRR churn measures the recurring monthly revenue lost from existing customers. Subscription businesses use it to see the financial effect of cancellations and downgrades.
4. Customer Acquisition Cost (CAC)
Customer Acquisition Cost is the cost of acquiring a new customer. Comparing CAC with retention and customer lifetime value shows whether the growth strategy can last.
5. Cohort Retention
Cohort analysis groups customers by a shared trait, such as sign-up month or first purchase date. The business can then compare how those groups behave over time.
A company may find that customers who joined during a promotional campaign churn at a higher rate than customers who arrived through referrals.
How to Perform Customer Churn Analysis
A useful churn analysis needs reliable customer data, a consistent way to measure, and a clear question. The steps below keep that work in order.
Step 1: Define the Measurement Period
Decide whether churn will be measured monthly, quarterly, or annually. The right period depends on the business model and how often customers buy.
A monthly subscription service may watch churn every month. A business with annual contracts may also look at quarterly and annual retention.
Step 2: Collect Customer Data
Pull the relevant records from customer relationship management (CRM) systems, billing platforms, subscription records, support systems, and product analytics tools.
Useful data may include:
- Customer registration and subscription dates
- Cancellation and renewal dates
- Purchase and payment history
- Product usage and engagement
- Customer support interactions
- Customer feedback and satisfaction scores
- Subscription plans and account changes
Step 3: Calculate the Churn Rate
Apply the customer churn formula to find the percentage of customers lost in the selected period. Keep the rules the same so results can be compared over time.
Step 4: Segment Customers
Split customers into groups so patterns that the overall churn rate hides can show up.
Possible segmentation categories include:
- Customer acquisition channel
- Subscription or pricing plan
- Geographic location
- Customer tenure
- Product usage frequency
- Customer industry or business size
A SaaS company may find that customers on one subscription plan leave more often than customers on other plans. That points the team toward pricing, features, or expectations as possible causes.
Step 5: Identify Patterns and Causes
Compare churn rates across segments and time periods. Look at changes in usage, payment behavior, support requests, and feedback before a cancellation.
Those patterns help separate common churn drivers from one-off complaints.
Step 6: Develop and Monitor Retention Strategies
Use the findings to make targeted changes. Those may include better onboarding, proactive support, personalized offers, product improvements, or payment recovery.
Keep watching churn and retention so you can see whether the changes are producing a real result.
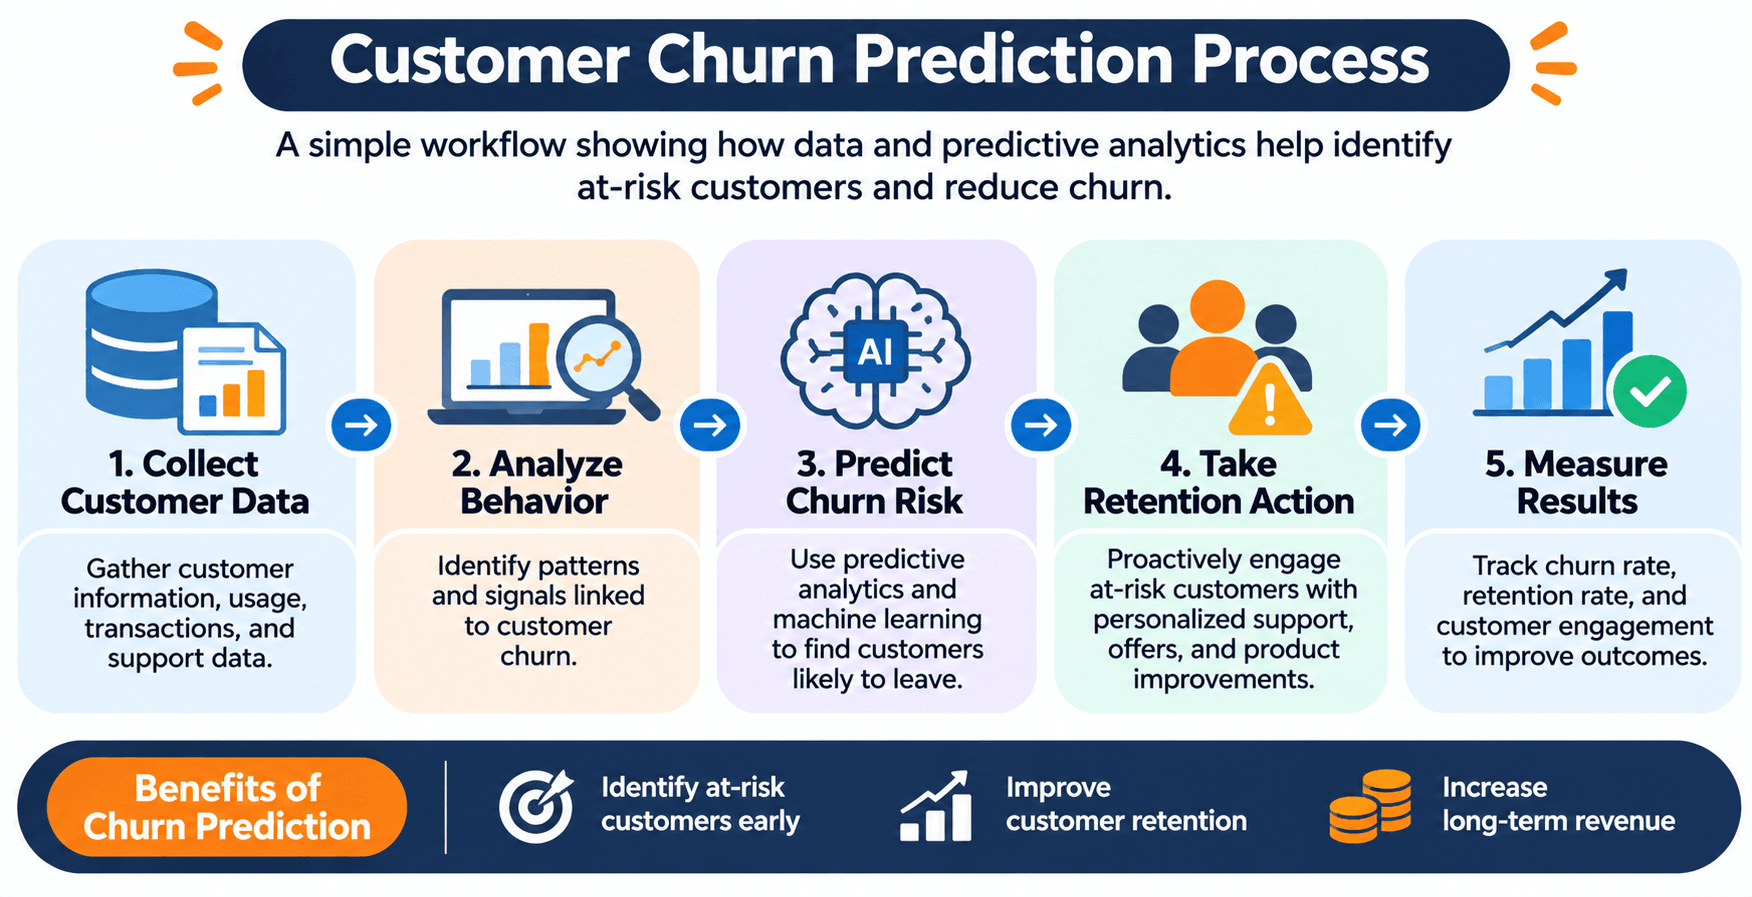
How Predictive Analytics Helps Identify Customer Churn
Traditional churn analysis explains what already happened. Predictive analytics estimates which customers are more likely to leave later.
It uses historical data, statistical techniques, and machine learning models to find patterns in customer behavior. Those patterns can flag churn risk before a customer cancels.
A subscription business, for example, may watch for customers who:
- Have significantly reduced their product usage.
- Have not logged in for an extended period.
- Frequently contact customer support about unresolved issues.
- Have experienced repeated payment failures.
- Show declining engagement with important product features.
When those signals are read together, a predictive model can estimate which customers have a higher likelihood of leaving.
Common Predictive Analytics Techniques
- Classification models: Estimate whether a customer belongs to a potential churn or non-churn group.
- Decision trees: Identify combinations of customer characteristics and behaviors associated with churn.
- Logistic regression: Estimate the probability of an outcome, such as whether a customer may leave.
- Cohort analysis: Compare retention patterns across groups of customers over time.
- Customer segmentation: Group customers according to shared behavior, needs, or characteristics.
Predictive results are estimates, not guarantees. Validate the models, watch data quality, and handle customer information responsibly.
To explore how businesses use data to understand customer behavior, read WFI's article on the power of predictive analytics.
How AI Can Support Customer Churn Analysis
Artificial intelligence can help a business work through large datasets, find patterns, and support retention decisions with better information.
Depending on the available data and business requirements, AI-powered analytics can support several activities:
- Churn prediction: Estimate which customers may be at risk of leaving.
- Behavior analysis: Identify changes in customer engagement and product usage.
- Customer segmentation: Group customers based on shared behavioral patterns.
- Sentiment analysis: Analyze customer reviews, survey responses, and support conversations to identify recurring concerns.
- Personalization: Help businesses develop relevant offers and communication strategies for different customer groups.
- Decision support: Present insights that help teams prioritize customer retention activities.
AI does not replace business judgment. Review the model output, consider the customer's situation, and choose the action. A prediction is not a certain outcome.
Professionals who want to develop these capabilities can explore WFI's Generative AI Data Analyst program, which is relevant to building practical data analysis and AI-related skills.
Tools Used for Churn Rate Analysis
Businesses use different tools to collect, organize, analyze, and visualize customer data. The right choice depends on data size, technical requirements, available resources, and how complex the analysis is.
1. Microsoft Excel
Excel works well for basic churn calculations, customer lists, data cleaning, and trend analysis. Functions, formulas, pivot tables, and charts help analysts organize customer information and calculate churn rates.
For smaller datasets, Excel is a practical place to start when you want to see retention patterns.
2. SQL
SQL retrieves and organizes customer information stored in relational databases. Analysts use queries to find customers who canceled, compare activity across periods, and prepare datasets for churn analysis.
It is especially useful when the customer database is large.
3. Python
Python supports more advanced analysis and predictive modeling. Libraries such as pandas, NumPy, scikit-learn, and Matplotlib help analysts clean customer data, explore churn patterns, build machine learning models, and visualize results.
4. Power BI
Power BI helps businesses create interactive dashboards and reports. Analysts can use it to monitor customer churn, compare retention across segments, and share findings with decision-makers.
5. Tableau
Tableau is a data visualization platform for exploring customer data through interactive charts and dashboards. It can show churn trends, customer segments, and retention patterns.
These tools do different jobs. Excel may be enough for simple calculations. SQL and Python can support more complex analysis. Business intelligence platforms such as Power BI and Tableau help explain the findings visually.
Developing practical skills with these tools is an important part of becoming a data analyst. Learn more about the Generative AI Data Analyst program at WorkForce Institute.
Strategies to Reduce Customer Churn
Finding churn is only the start. The business has to use what the analysis shows to improve the customer experience and deal with the reasons people leave.
1. Improve Customer Onboarding
A confusing start can keep customers from seeing the product's value. Give clear instructions, useful tutorials, and guidance that helps new customers finish the tasks that matter.
2. Monitor Customer Engagement
Track product usage, login frequency, feature adoption, and other engagement signals that fit the product. A drop in activity can mean a customer needs more support.
3. Address Customer Feedback
Collect feedback through surveys, reviews, interviews, and support conversations. Look for complaints that repeat, and put the common problems first.
4. Personalize Customer Communication
Use preferences, purchase history, and engagement patterns to make communication more relevant. Guidance and recommendations that fit the customer can help them get more value from the product or service.
5. Resolve Support Issues Quickly
Unresolved complaints and repeated service problems damage the relationship. Make it easy to ask for help, and make sure support teams can follow an issue through to a resolution.
6. Improve Product and User Experience
Complicated navigation, confusing workflows, and missing features can lower satisfaction. Watch how customers use the product and look for friction you can remove.
For another perspective, explore WFI's article on how UX can help reduce churn for B2B SaaS products.
7. Identify At-Risk Customers Early
Use customer data and predictive analytics to find customers who show signs of pulling away. The team can then prioritize outreach, offer relevant help, and deal with problems before the customer decides to leave.
8. Review Pricing and Subscription Options
Pricing that does not match what customers need, or what they think the product is worth, can drive cancellations. Review feedback, how subscriptions are used, and competitor offers before you decide whether plans or prices should change.
Common Challenges in Customer Churn Analysis
Churn analysis can be useful, and businesses still run into problems when they collect and read customer data.
- Incomplete data: Missing customer records or inconsistent cancellation information can affect calculations.
- Disconnected systems: Customer information may be spread across CRM, billing, support, and analytics platforms.
- Incorrect measurement: Inconsistent definitions of active customers, cancellations, or measurement periods can produce misleading results.
- Limited customer context: A churn prediction may identify risk without explaining the underlying reason.
- Changing customer behavior: Customer preferences and market conditions can change, making historical patterns less reliable.
- Privacy and data security: Businesses must handle personal and behavioral information responsibly.
Reliable records, consistent metrics, and checked methods help. So does pairing the numbers with what customers actually say.
How Data Analytics Skills Help Professionals Understand Customer Churn
Customer churn analysis uses several data skills at once. You collect and clean data, calculate metrics, find patterns, read the results, and explain what to do next.
Some of the most useful skills include:
- Data cleaning and preparation
- Spreadsheet analysis and Excel formulas
- SQL querying and database management
- Python for data analysis
- Data visualization and dashboard development
- Statistical analysis
- Predictive analytics and machine learning fundamentals
- Business communication and analytical problem-solving
These techniques help professionals approach a business problem with evidence instead of assumptions.
If you want to build your knowledge of data analysis and explore how AI can support analytical work, consider the Generative AI Data Analyst program by WorkForce Institute.
Frequently Asked Questions About Churn Rate Analysis
What is churn rate analysis?
Churn rate analysis measures customer loss and looks at why customers stop using a company's products or services. It helps a business find retention problems and plan how to improve the relationship.
How do you calculate customer churn rate?
Divide the number of customers lost during a period by the number of customers at the start of that period, then multiply by 100.
Customer Churn Rate = (Customers Lost / Starting Customers) × 100What is a good customer churn rate?
No single churn rate is good for every business. An acceptable rate depends on the industry, business model, subscription frequency, customer segment, and measurement period. Compare your results with relevant industry benchmarks and with your own past performance.
What is the difference between customer churn and revenue churn?
Customer churn measures the percentage of customers lost during a period. Revenue churn measures the recurring revenue lost from existing customers. A company can lose a small number of high-value customers and still take a large hit to revenue.
How can businesses reduce customer churn?
Businesses can reduce churn by improving onboarding, watching engagement, resolving support issues, collecting feedback, personalizing communication, and finding at-risk customers through data analysis.
How does predictive analytics help with churn prediction?
Predictive analytics looks at historical customer data and behavior to estimate who is more likely to leave. Teams can use that estimate to put retention effort where it is needed sooner.
Which tools are used for churn rate analysis?
Common tools include Microsoft Excel, SQL, Python, Power BI, and Tableau. Businesses may also use CRM platforms, customer analytics systems, and machine learning tools, depending on what they need.
Can beginners learn customer churn analysis?
Yes. Beginners can start with spreadsheet formulas, basic statistics, and the churn calculation. They can then add SQL, Python, data visualization, and predictive analytics.
Conclusion
Churn rate analysis helps a business see customer loss, recognize patterns in behavior, and find ways to keep more customers. Measuring churn the same way each time, and looking at the related metrics, supports better decisions about experience, product changes, and retention.
As businesses collect more customer data, SQL, Python, data visualization, and predictive analytics become more useful for reading that behavior. Those skills help turn raw data into insights that support better decisions.
Interested in developing practical data analysis and AI-related skills? Explore the Generative AI Data Analyst program at WorkForce Institute to learn more about building relevant capabilities for data-driven work.